

Freddie Mac reported that the 30-year fixed-rate mortgage averaged 6.30% for the week ending April 16, down from 6.37% the prior week and well below the 6.83% recorded one year ago. The 15-year fixed rate fell to 5.65%, down from 5.74%. Freddie noted that the decline was a meaningful improvement for homebuyers during the busy spring season.
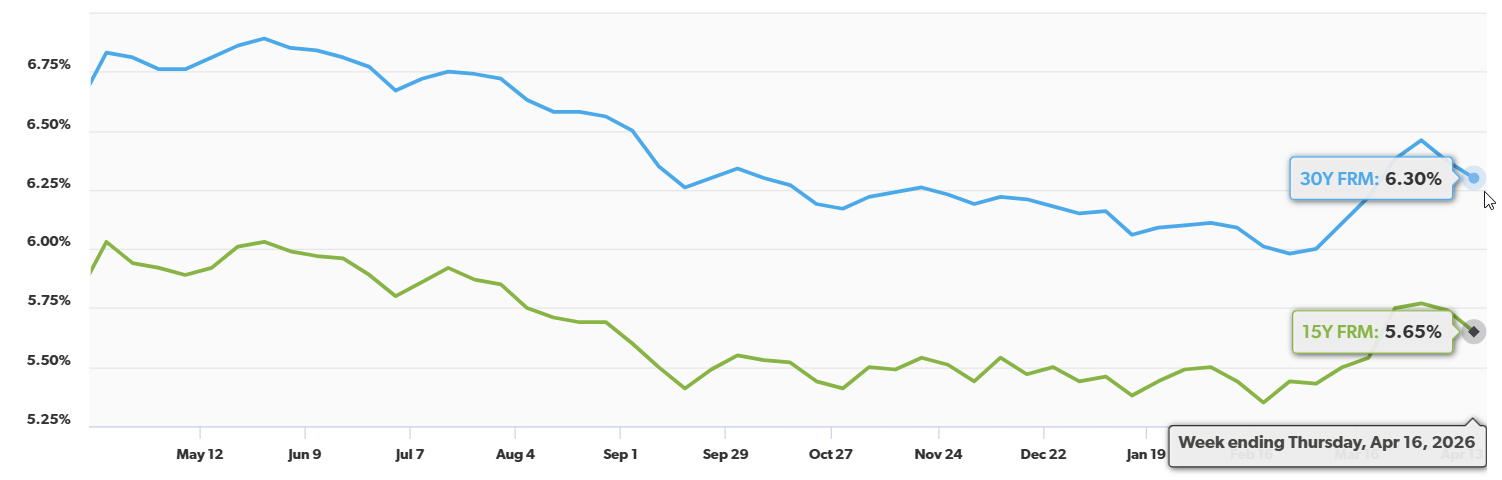
Source: Freddie Mac (April 2026)
Eric Revell of Fox Business noted that the rate decline followed a two-week ceasefire between the U.S. and Iran, which eased Treasury yields to around 4.29%. The relief in the 10-year Treasury yield has carried through to mortgage rates. “The decline in mortgage rates follows a two-week ceasefire between the U.S. and Iran, brokered with help from Pakistan, that was framed by the White House as a step toward broader negotiations.”
The Mortgage Bankers Association (MBA) reported that mortgage applications increased 1.8% for the week ending April 10. The refinance index rose 5%, reaching 15% above year-ago levels, while the purchase index edged down 1%. The 30-year conforming rate fell from 6.51% to 6.42%, and the refinance share of applications climbed to 45.5% from 44.3% the prior week.
“Given the evolving situation in the Middle East and its impact on energy and commodity prices, mortgage rates declined last week. The 30-year fixed rate decreased to 6.42 percent, its lowest level in a month,” said Joel Kan, MBA’s Vice President and Deputy Chief Economist. “This dip in rates helped to support an increase in conventional refinance applications, which had declined for five consecutive weeks. Purchase activity remained subdued as potential homebuyers remained hesitant given the current economic uncertainty, which kept purchase applications below last year’s level for the second consecutive week. Conventional purchase applications were essentially unchanged over the week, while FHA and VA purchase applications declined.”
Neil Pierson of HousingWire wrote that mortgage spreads dropped from 2.11% to 2.05% over the past week, noting that if the past three years’ spreads held today, rates could be between 6.88% and 7.45%. The University of Michigan Consumer Sentiment Index fell to 47.6 in its April reading, the lowest in over 70 years. CME FedWatch shows 99.5% of traders expect the Fed to hold rates steady through April, with the funds rate at 3.5% to 3.75%.
“Prospective homebuyers have significant headwinds in their purchase journey, as indicated by the University of Michigan’s Consumer Sentiment Index for April. The initial index reading of 47.6 for this month was down significantly from March and represented the lowest level in the 70-plus-year history of the survey.”
Lawrence Yun, NAR’s Chief Economist, delivered through Inman a reality check for anyone holding their breath for sub-3% mortgage rates, pointing to structural headwinds that make a return to pandemic-era lows highly unlikely. Beyond the debt and inflation angle, Yun zeroed in on the “K-shaped” economy, where higher-income households continue to transact while lower earners get squeezed out, alongside consumer confidence at historic lows. He also flagged oil price volatility tied to global conflict as an underappreciated wildcard that could keep upward pressure on both inflation and borrowing costs.
Seller optimism
Dana Anderson of Redfin reported that U.S. pending home sales fell 4.1% year over year during the four weeks ending April 12, the biggest decline in over a year. The median sale price reached $393,059, up 2.3% YoY, while homes spent a median 48 days on the market. Sales fell in all but seven of the 50 biggest metro areas, with San Francisco, West Palm Beach, and Miami among the few posting gains.
That said, Hannah Jones of Realtor.com found that 83% of those planning to sell in the next 12 months expect to receive their asking price or more, with 37% expecting to exceed it. Concessions are rising; 39% of sellers anticipate having to make concessions in 2026, up from 30% last year. Homes listed the week of April 12 to 18 attract 16.7% more views than a typical week and sell roughly nine days faster, with median listing prices approximately $26,000 above January levels.
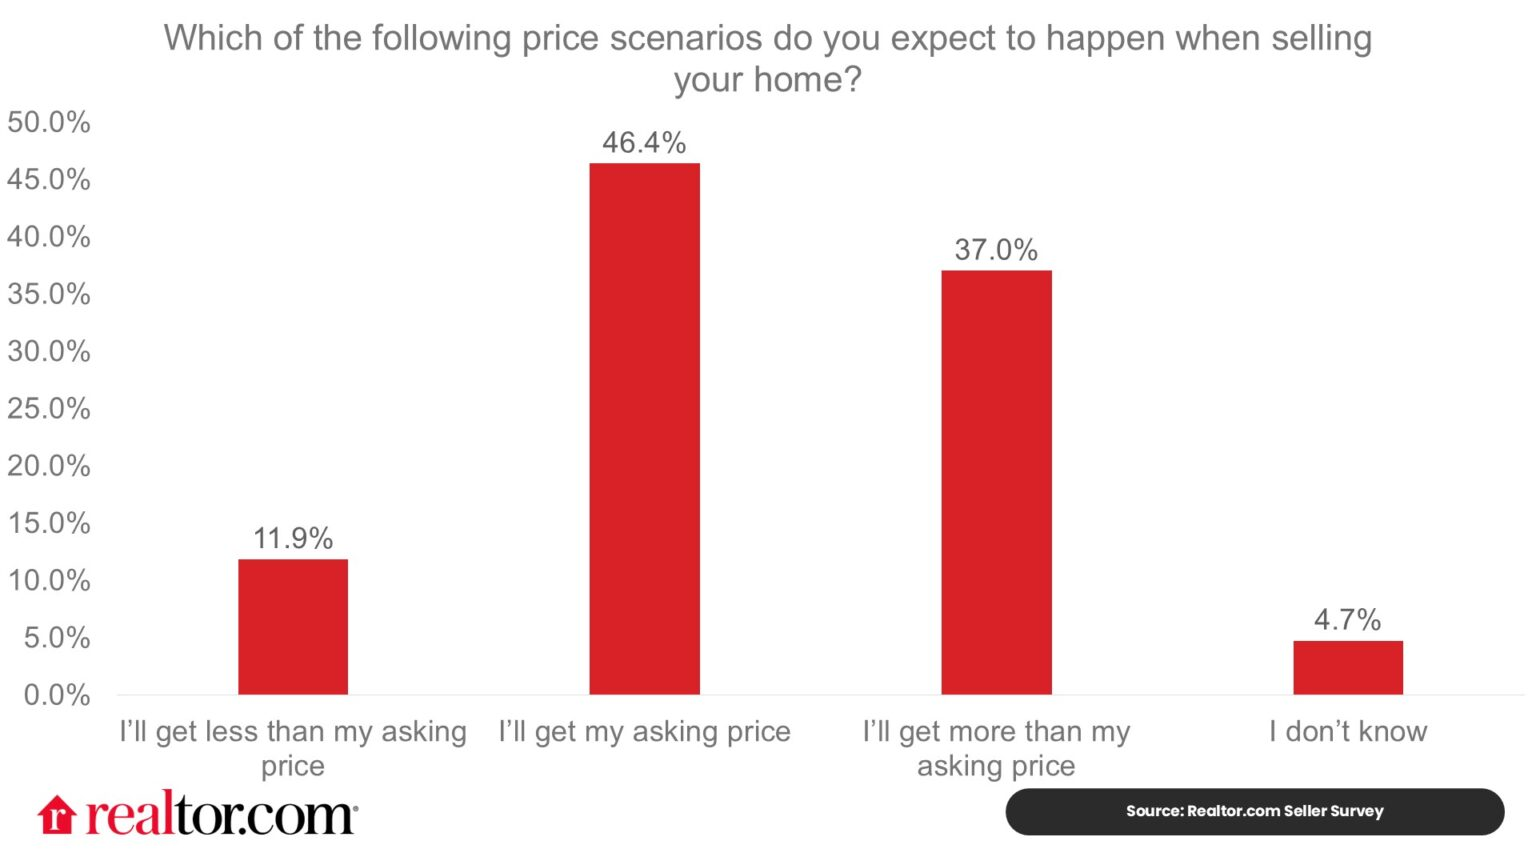
Source: Realtor.com (April 2026)
“Seller sentiment reflects the broader housing landscape: 40% describe the current market as a seller’s market, 33% see it as balanced, and 27% view it as favoring buyers. Regionally, sellers in the South and West leaned more toward a buyer’s market view than other regions, consistent with rising inventory in those areas. Meanwhile, nearly half of potential sellers in the Northeast saw conditions as favoring sellers, a reflection of tight inventory and strong competition there.”
Further, 74% of potential sellers believe now is a good time to sell, while 40% describe the current market as favoring sellers. The top motivation for selling is profit (41%, up from 36% in 2025), followed by seeking a different neighborhood (41%) and needing more space (39%). Eight in 10 plan to stay within their current state, with more than half moving within the same county.
Dana Anderson of Redfin reports that spring’s homebuying season has stalled, with pending sales down 4.1% year over year during the four weeks ending April 12, the biggest drop in over a year. Declines hit 43 of the 50 largest metros, led by Providence (-17.5%), Houston (-16.9%), and Nassau County (-14.8%). Touring activity is up just 11% since January, compared with 40% over the same period last year. Mortgage rates eased to 6.3% but remain volatile amid headlines about the Iran war, while the median sale price jumped 2.3% annually, squeezing budget-conscious buyers already rattled by rising gas, food, and energy costs. New listings also slipped 1.4% as sellers wait out the soft demand.
Melissa Dittmann Tracey of REALTOR Magazine identified the week of April 12 to 18 as the best window to list in 2026, based on analysis of housing trends from 2018 to 2025. Homes listed during this period see about 19% fewer price reductions and spend roughly 10 fewer days on the market than the yearly average. The Northeast and Midwest remain undersupplied, while sellers in the South and West face softer conditions.
Finally, Zillow reported that pending sales posted their largest March increase in five years, with newly pending listings rising 4.6% year over year to 281,546. Average daily page views per listing on Zillow were 32% higher than in March 2020. The typical U.S. home is valued at $365,545, up 0.8% YoY, with 1.23 million homes for sale nationwide.
“Buyers and sellers have been navigating uncertainty and market volatility in some form since the onset of the pandemic, and this month’s concern over energy prices is no different,” said Mischa Fisher, chief economist at Zillow. “However, we have persistent signals that the market has turned a corner. Pent-up demand from three years of low sales volume and winter storms in January and February, along with the tailwind from lower mortgage rates earlier in the year, seem to have buoyed the market as home shopping season kicked off. In particular, the rapid acceleration of daily page views per listing we saw in March was a noteworthy improvement over the dormant market of recent years.”
Construction
Danushka Nanayakkara-Skillington of the National Association of Home Builders (NAHB) reports that single-family permitting cratered at the start of 2026, with just 62,034 permits issued nationwide in January, a 15.2% drop from the same month last year. Every region posted declines, led by the West at -20.1% and followed by the South (-14.7%), Northeast (-10.6%), and Midwest (-9.1%). Forty-two states plus DC saw year-over-year drops, with the District posting the steepest fall at -52%. Texas, Florida, and North Carolina topped the leaderboard, but all moved backward, with Texas alone down 21.3% despite issuing 9,580 permits.
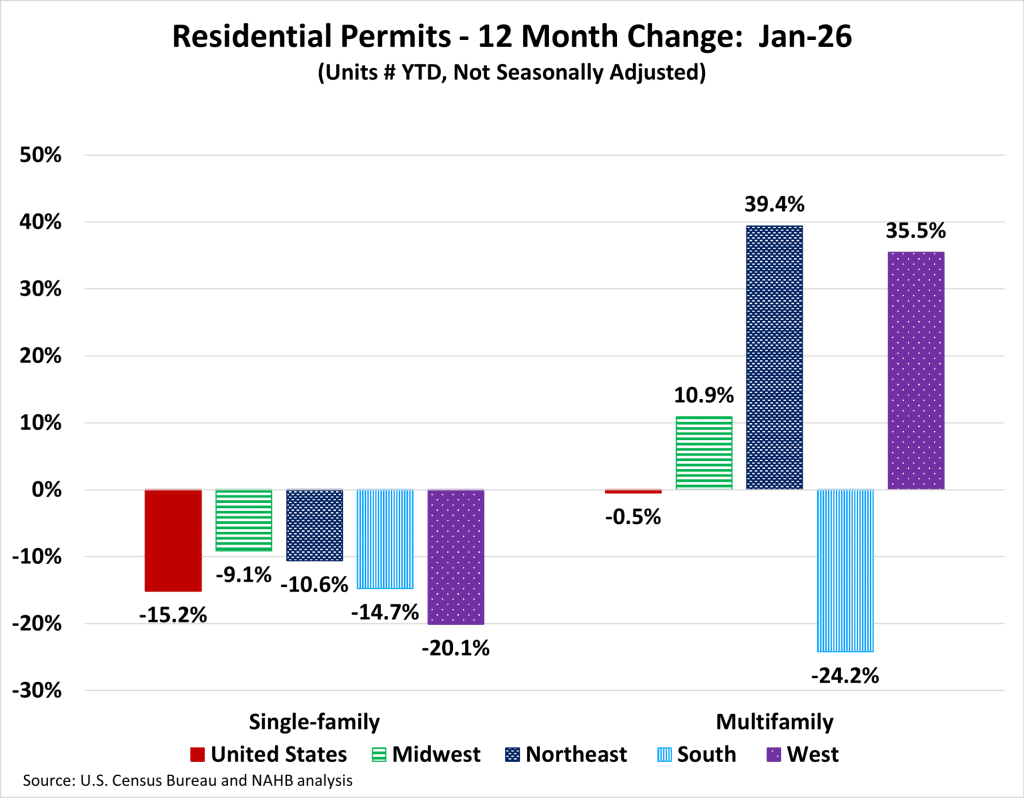
Source: NAHB (April 2026)
Multifamily held steady at 38,215 permits (-0.5%), buoyed by a 39.4% surge in the Northeast and 35.5% jump in the West, though the South dragged the category down with a 24.2% decline tied to sharp pullbacks in Atlanta (-42%) and Houston (-39%).
NAHB also reports that builder confidence is flashing red, with the NAHB/Wells Fargo Housing Market Index sliding four points to 34 in April, well below the 50 threshold separating optimism from pessimism. The forward-looking component took the hardest hit, with six-month sales expectations tumbling seven points to 42, while current sales conditions fell four points to 37 and prospective buyer traffic dropped three points to a dismal 22. Price cuts remained widespread, with 36% of builders slashing prices in April, averaging a 5% reduction. Sales incentives were offered by 60% of builders, the 13th straight month at or above that threshold, underscoring just how hard builders are working to keep deals alive in a cooling market.
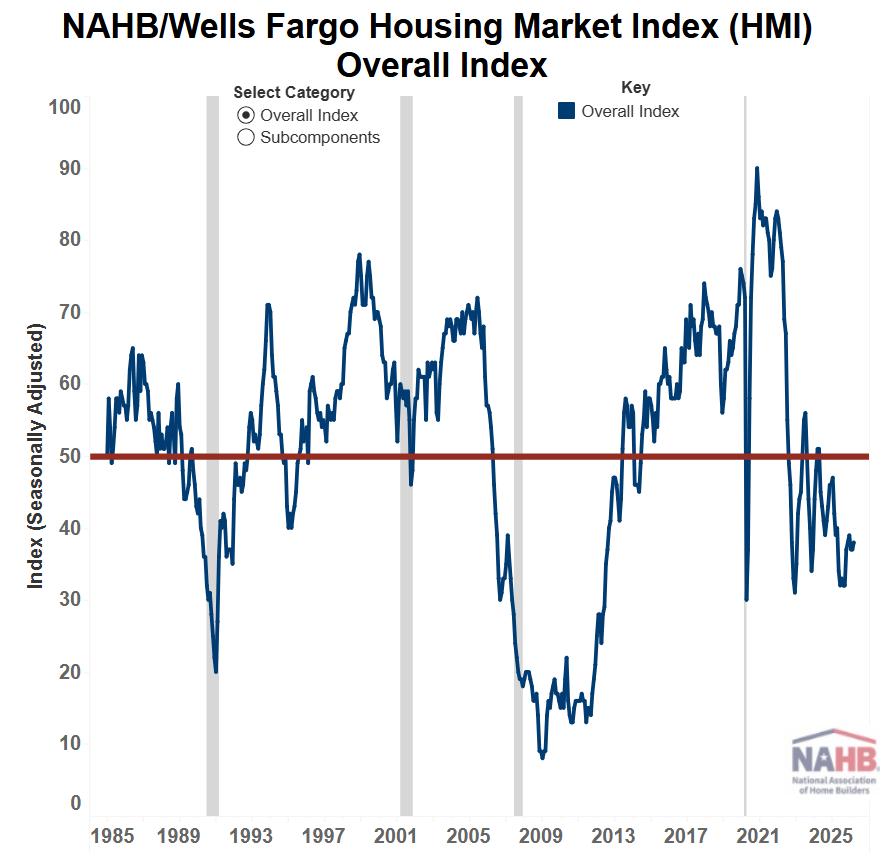
Source: NAHB (April 2026)
Joel Berner introduces Realtor.com’s new Land Price Estimates, revealing that the vacant land market never fully healed from the pandemic-era building frenzy. Q1 2026 saw 426,986 land listings nationwide at a median price of $62,365 per acre, with inventory still sitting well below pre-pandemic norms after builders cleared out listings during the ultralow-rate boom of 2020 and 2021.
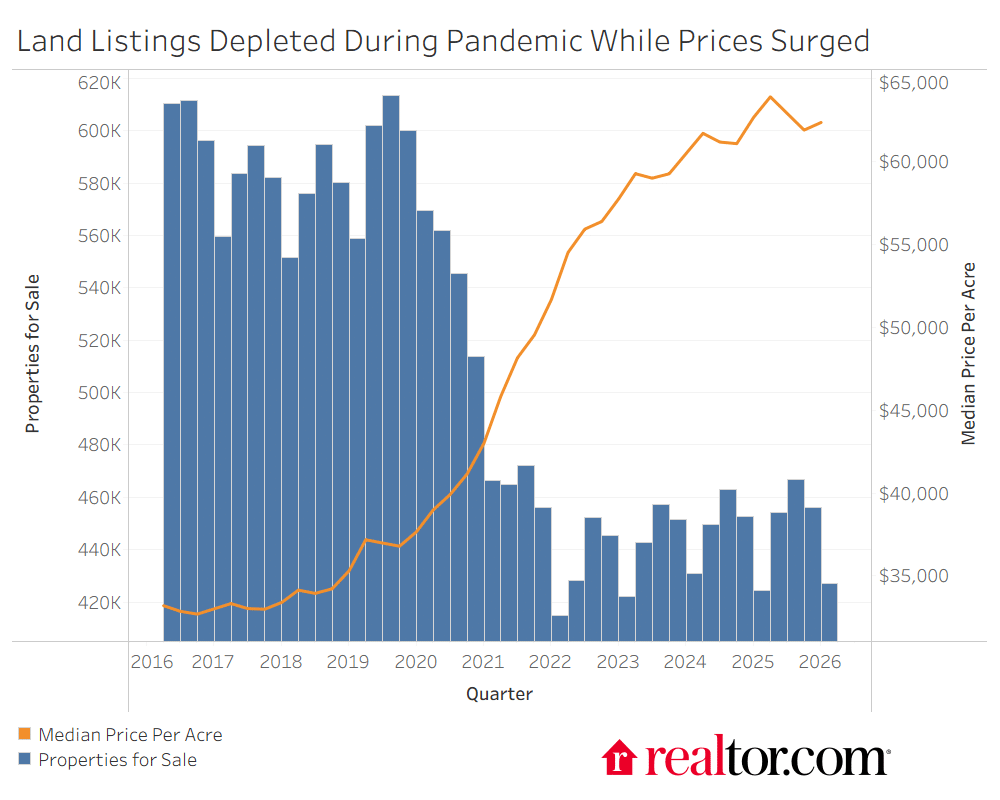
Source: Realtor.com (April 2026)
Raw land has posted the sharpest price appreciation versus pre-pandemic levels, with the biggest gains concentrated in affordable markets that became magnets for COVID-era relocators. The past year has brought some cooling as builders dial back new construction, with the West leading the way in lower land prices. The data also segments the market into three tiers: raw land with no development, partly developed lots with some clearing or utilities, and build-ready parcels primed for immediate construction.
“The trends over the past several years for land listings and home listings have been remarkably similar. Before the pandemic, prices for both land and homes were steadily rising. In early 2020, inventories for both plummeted while prices shot up. The years 2021 and 2022 saw intense, sustained price growth and inventory reduction during the ultralow rate period, and in 2023, growth rates for both land and homes started to come back to earth before flattening in 2024. The notable deviation between land and home listings can be seen in inventory recovery from 2024 on.”