

Dana Anderson of Redfin reported that U.S. pending home sales climbed to 340,101 on a seasonally adjusted basis in the four weeks ending May 3, the highest level since September 2022 and up 7.7% year over year. The jump came after the daily 30-year fixed mortgage rate slipped from a six-month high of 6.46% to 6.23% before bouncing back, while active listings ran near a five-year high at 1,477,250. Pending sales rose in 46 of the 50 most populous metros, led by Chicago (up 19.2%), Pittsburgh (up 16.5%), and San Francisco (up 15.2%).
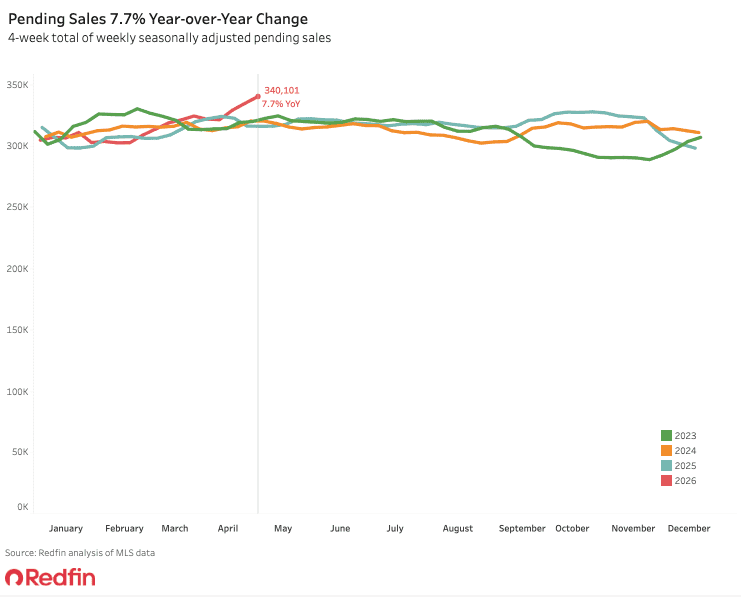
Source: Redfin (May 2026)
“Some homes are attracting multiple offers, but only those that are priced fairly and have been updated. A new kitchen and new bathroom are the ticket to a bidding war. Older homes that need repairs, and those far above the most popular price range – around $400,000 in Chicago – are taking longer to sell.”
That said, Redfin highlightes that the headline number masks a softer underlying market: the typical home now takes 43 days to go under contract (three days longer than a year ago), only 26.4% of homes are selling above asking price (the lowest share for this time of year in at least five years), and the average sale-to-list ratio slipped to 98.7% from 99% a year ago. New listings actually fell 1.8% year over year on a seasonally adjusted basis, suggesting sellers remain reluctant even as buyer activity picks up.
Further, Giulia Carbonaro of Newsweek framed the move as a delayed start to spring, citing Reventure App’s Nick Gerli, who described the activity as buyers playing catch-up after Easter following an unusually weak start to the year. Realtor.com senior economist Jiayi Xu told Newsweek that shopping multiple lenders can save borrowers up to 0.55 percentage points – more than $40,000 over the life of a 30-year loan – making lender selection one of the most powerful affordability levers in a 6%-plus rate environment.
However, Diana Olick of CNBC reported that mortgage rates rebounded to a one-month high of 6.45% on the 30-year conforming loan, dragging total mortgage application volume down 4.4% week over week and purchase applications down 4%. The average purchase loan size hit a record $467,300 since the MBA survey began in 1990, a sign that lower-income and entry-level buyers are pulling back. MBA deputy chief economist Joel Kan attributed the shift to economic uncertainty and elevated rates, squeezing the most rate-sensitive segment of the market.
Finally, Laura Grace Tarpley of TheStreet drew on NAR’s May 2026 Market Dynamics study and noted that May has historically been the busiest month of the year for existing-home sales, with sales typically rising 10.7% month over month and homes spending just 30 days on market (tied with June for the lowest of the year). NAR economist Chris Lux cautioned that those benchmarks come from pre-pandemic springs (1999-2019) and that 2026 competition will likely be milder; the first-time buyer share also tends to dip 0.6% in May as seasonal prices peak.
New home sales surge
The U.S. Census Bureau and HUD reported that March new single-family home sales jumped 7.4% from February to a seasonally adjusted annual rate of 682,000, also 3.3% above March 2025. The median sales price plunged to $387,400, down 5.3% from February and down 6.2% year over year, while the average price fell to $503,100. Inventory of new homes for sale slipped to 481,000 units (8.5 months of supply, down from 9.1 months in February but still well above the 4-to-6-month normal range).
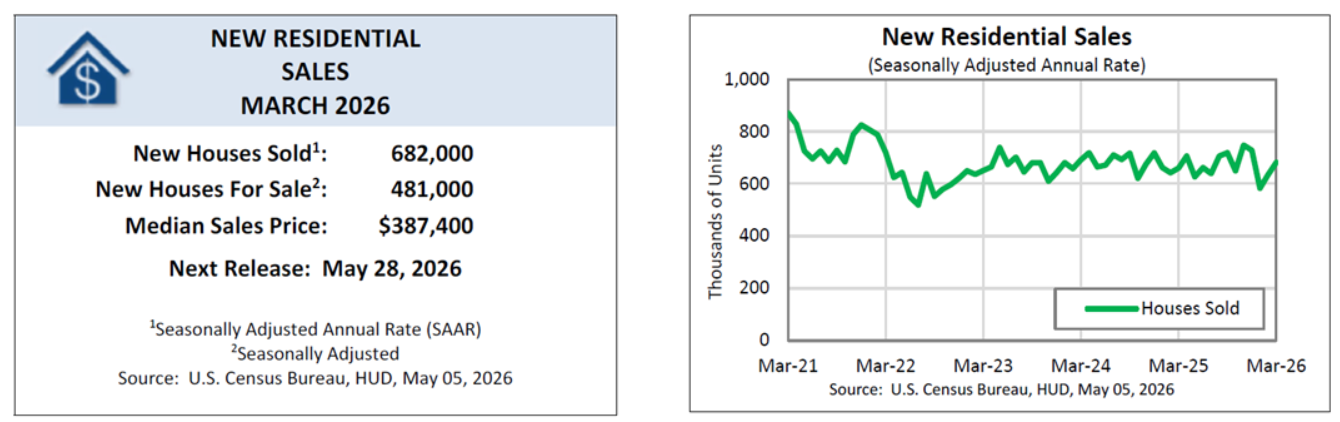
Source: U.S. Census Bureau (May 2026)
That said, Bill McBride of CalculatedRisk added important context, noting that the median new-home price is now down 16% from its peak largely because of a shift in the mix toward smaller, lower-priced homes, not because of comparable price cuts on identical products. Inventory of completed homes for sale stands at 121,000, nearly four times the February 2022 record low of 31,000, while homes ‘not started’ hit an all-time high of 111,000 as builders hold construction starts in reserve.
Further, Tristan Navera of Realtor.com argued that the new-home segment is now the leading edge of broader price softness, with economist Joel Berner warning that builders are more responsive to buyer demand than existing-home sellers and that the price softness will likely spill into the existing segment soon. The rebound is also notable against a brutal start to the year: January new-home sales fell 17.6% from December and 11.3% year over year, the largest single-month drop since June 2013.
The National Association of Home Builders (NAHB) credited the gain to a modest pullback in mortgage rates and ongoing supply constraints in the existing-home market, but cautioned that elevated construction costs and labor shortages continue to limit production. Year-to-date regional sales are sharply uneven: Midwest +8.0%, South -2.6%, West -14.0%, and Northeast -17.6%. The median new-home price has now fallen 9.7% from its December 2025 peak of $429,100, and completed ready-to-occupy inventory is up 5.3% year over year at 119,000 homes.
Finally, Lance Murray of The MortgagePoint highlighted a striking crossover, citing First American deputy chief economist Odeta Kushi, who noted that the median new-home price ($387,400) now sits below the median existing-home price ($408,800) for the first time in years. In March, 54% of new-home sales closed below $400,000 (up from 47% a year ago), 36% of builders were cutting prices in April (average cut of 5%), and total building permits fell 10.8% from February to 1,372,000 (down 7.4% year over year), suggesting the production pipeline is tightening even as current sales accelerate.
Apartment vacancy hits an eight-year high
Chris Bruen of the National Multifamily Housing Council (NMHC) reported that the Census Bureau’s rental vacancy rate for buildings with five or more units rose 70 basis points year over year to 8.9% in Q1 2026, the highest reading since 2017. CoStar’s total vacancy rate sat at 8.5% (up 17 bps year over year) while RealPage’s same-store rent growth turned negative at -0.5% nationally. The South was hardest hit, down 2.1% per RealPage, while the Midwest (+1.9%) and Northeast (+0.8%) continued to grow. Annual absorptions of 303,377 units were down 58% year over year, the lowest in over two years.
That said, CoStar and Apartments.com have raised their U.S. multifamily vacancy forecast to 8.8% by year-end 2026, with the rate now expected to peak in early 2027 before easing to 8.4% by the end of that year. Q2 2026 rent growth was nudged up 10 basis points to 0.5%, but second-half 2026 projections were lowered as softer employment assumptions and the backlog of excess inventory from the 2021-2024 construction wave continue to weigh on fundamentals.
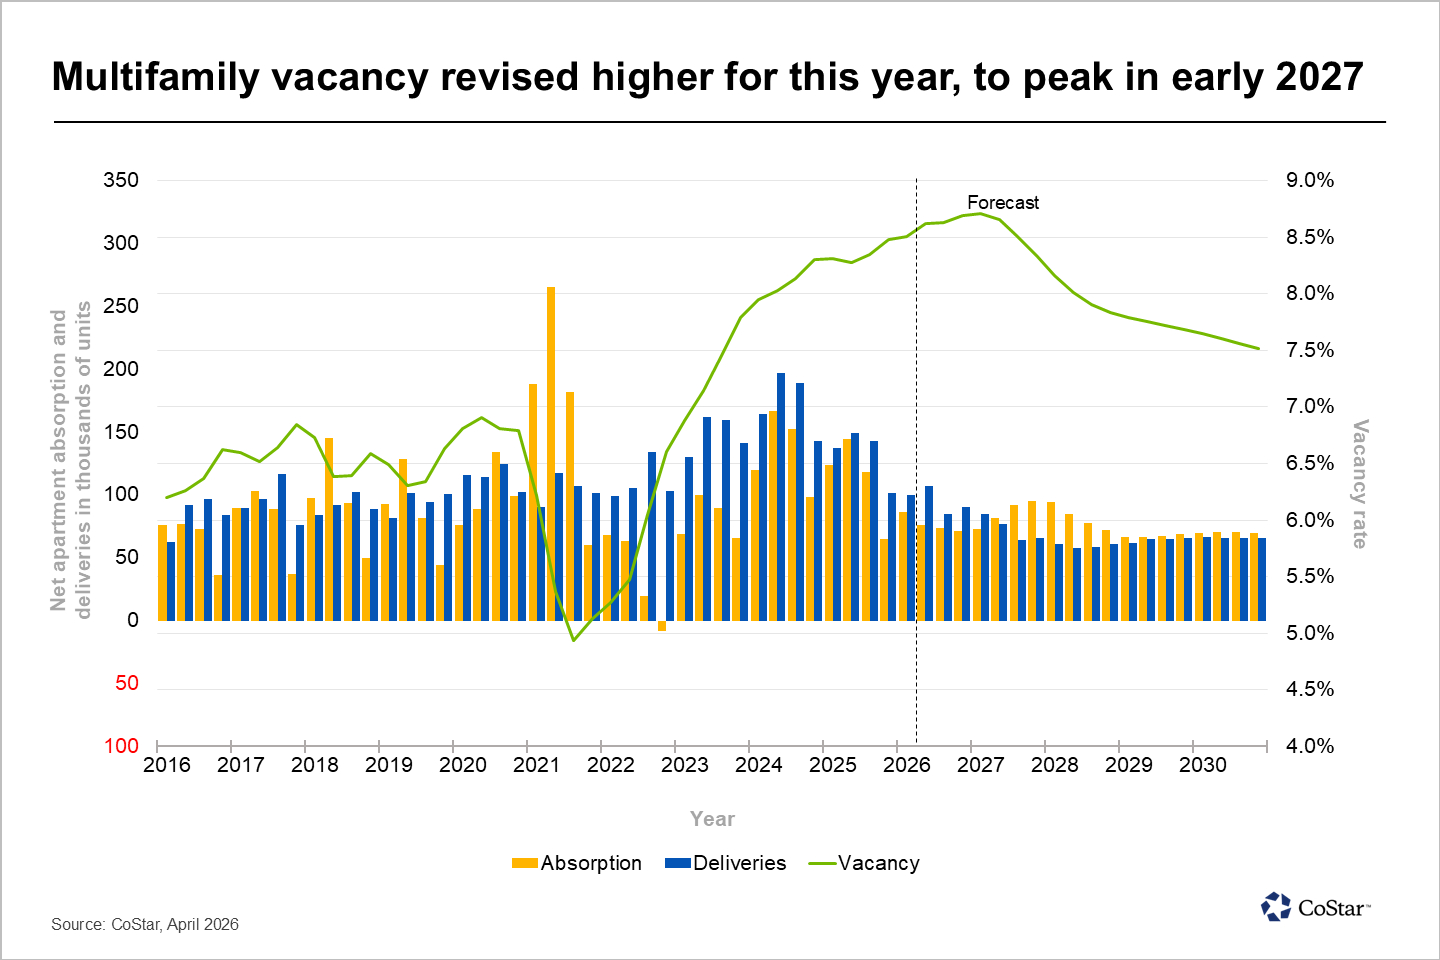
Source: Business Wire (May 2026)
Further, CoStar provided a broader analysis, reporting that U.S. multifamily vacancies are now expected to climb above previously projected levels through 2026, before peaking in early 2027 as rent growth softens. The CoStar coverage signals that operators counting on a 2026 inflection should reset expectations, since the peak vacancy moment has been pushed out by roughly two quarters from prior forecasts.
However, Kim O’Brien of RealPage offered a counterpoint, reporting that U.S. apartment occupancy rose back above 95% in April for the first time in seven months, hitting 95.2% (up 60 bps from the end-of-2025 low). Effective asking rents rose 0.5% in April, the fourth consecutive monthly gain. The pain remains heavily geographic: Austin and Denver rents are each down more than 6% annually, the South is approaching three full years without positive annual rent growth, and tech-hub markets are leading the recovery (San Francisco +9.6%, San Jose +5%, Virginia Beach +4.6%).
“San Francisco once again led the nation, posting a 9.6% effective asking rent increase in the year-ending April. This was by far the strongest gain among the largest 50 U.S. apartment markets. San Jose also remained near the top of the rankings with a 5% increase, while Virginia Beach saw growth of 4.6%. A handful of Midwest markets with limited new supply volumes also continued to see rent gains, though the increases were more modest. Annual rent growth was between 1.8% and 3.1% in Milwaukee, Chicago, Minneapolis, St. Louis and Cincinnati.”
Finally, Bill McBride of CalculatedRisk synthesized multiple rent benchmarks and documented that the Apartment List national median rent is down 1.7% year over year to $1,370 (the steepest annual decline in the dataset’s history going back to 2017) and 5% below the 2022 peak. Apartment List’s own vacancy gauge ticked down to 7.2% in April, the first decrease in over four years, while Realtor.com data shows a 32nd consecutive month of year-over-year rent declines. McBride cautions that immigration policy headwinds will likely keep rents soft even as new completions slow.