

Apartment List reports that the national median rent ticked up 0.2% in February 2026 to $1,357, snapping a six-month streak of declines as the market begins its seasonal recovery heading into peak moving season. Despite the uptick, rents remain 1.5% below year-ago levels and have now fallen 5.9% from their 2022 peak. The national multifamily vacancy rate hit a record 7.4%, driven by new supply colliding with sluggish demand, while units are now taking an average of 40 days to lease, more than double the pace seen during the red-hot market of mid-2021.
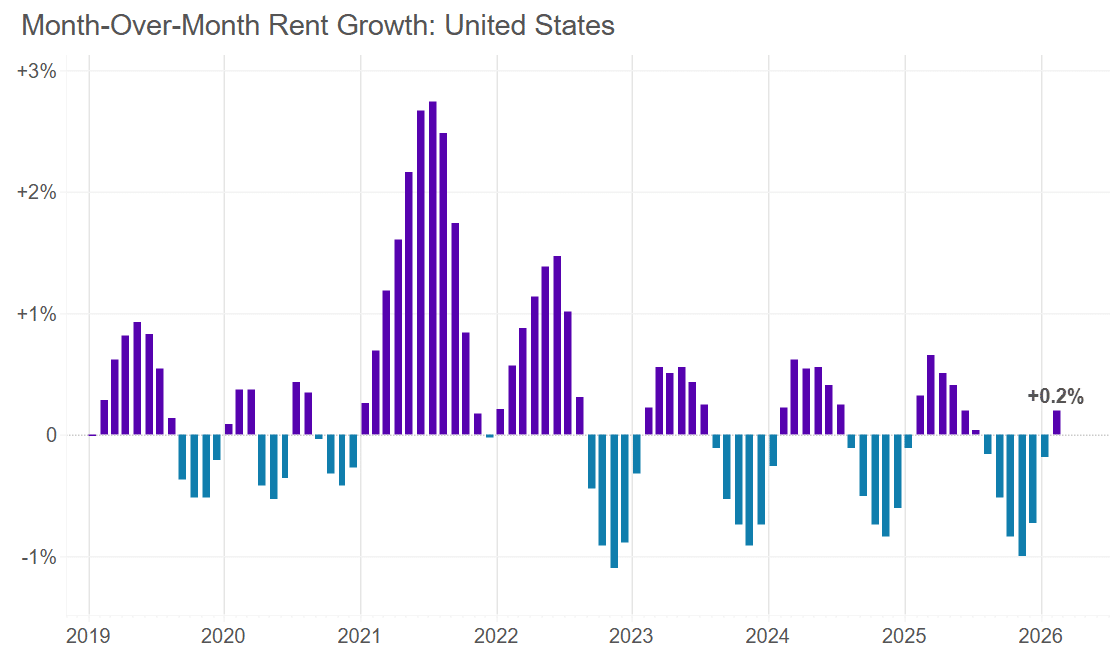
Source: Apartment List (March 2026)
Among large metros, Austin, TX remains the softest market with rents down 5.9% year over year, while Virginia Beach, VA leads the pack with 5.3% growth.
“Rents prices have consistently followed this seasonal pattern, but in recent years we’ve seen sharper winter dips and more modest summer bumps as the market has gone through a soft spell amid a wave of new multifamily construction. In addition to steeper winter declines since 2022, we have also observed a slight shift in the timing of rental market seasonality. Whereas May used to be the annual peak for rent growth, over the past three years March has been the hottest month, with rent growth slowing down during what were, prior to the pandemic, the months when prices would increase most quickly.”
Crystal Chen and Quentin Proctor of Zumper note that while national rents continue their annual decline, the cooldown is losing steam for a second consecutive month, with one-bedroom medians down 1.7% to $1,499 and two-bedroom medians off 1.4% to $1,878. The standout story is San Francisco, where two-bedroom rents have surpassed New York City for the first time since 2023, hitting $5,120, and annual growth is surging at 15.6% for one-bedrooms and a remarkable 21.3% for two-bedrooms, making it the only top-10 city posting double-digit gains.
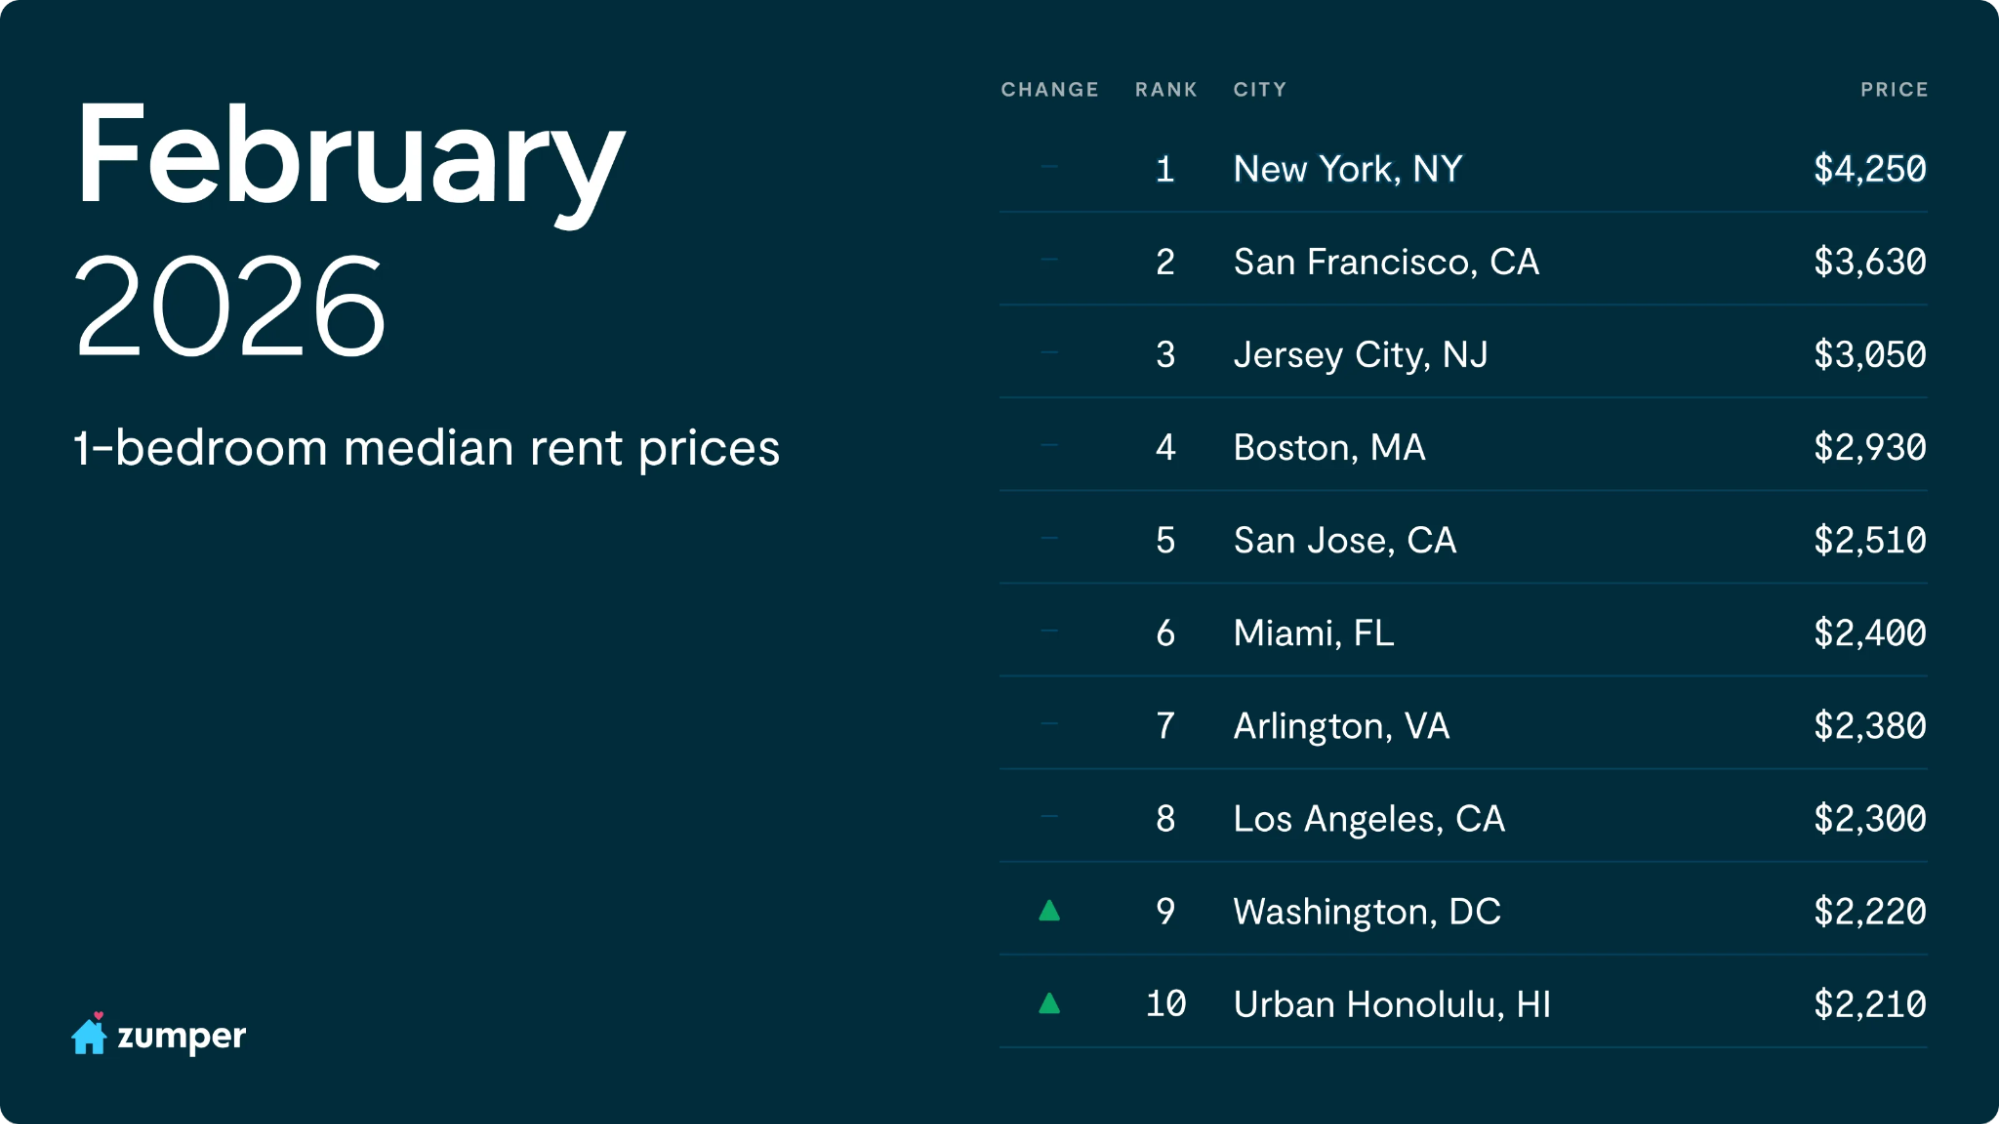
Source: Zumper (March 2026)
On the flip side, Tennessee markets are struggling across the board, with Knoxville leading the slide at a 13.2% year-over-year drop in one-bedroom rents, while Honolulu quietly climbed into the top 10 most expensive cities, bumping San Diego off the list.
Anthemos Georgiades, CEO of Zumper, comments:
“Our latest national rent data shows early signs that the declines of the last few quarters are moderating as the market begins to rebalance…The unusual rent cuts seen last summer and fall appear to have largely run their course, with winter pricing returning to a more typical seasonal pattern. While it’s still early, the consistency in recent data suggests fall 2025 may have marked a cyclical low for many rental markets, especially in supply-heavy Sun Belt and Mountain West regions that are still working through excess inventory.”
Jiayi Xu and Danielle Hale of Realtor.com zero in on how rising vacancies are reshaping the power dynamic between renters and landlords, with the average vacancy rate across the top 50 metros climbing to 7.6% in 2025, well above the pre-pandemic average of 6.9%. That shift has decisively tilted the landscape: 22 of the 50 largest metros now qualify as renter-friendly, 22 are balanced, and only 6 still favor landlords. The Sun Belt is ground zero for this shift, with 16 of the 22 renter-friendly markets located in the region, led by Birmingham, AL, at a 14.3% vacancy rate, followed by Austin, TX at 13.8%. Milwaukee saw the most dramatic turnaround, flipping from landlord-friendly to renter-friendly as vacancies more than doubled to 10.8%.
Affordability
Michael Krein of HousingWire flags a widening crack beneath the surface of U.S. housing, pointing to Federal Reserve Bank of New York data showing overall household delinquencies climbed to 4.8% in Q4, their highest level in nearly a decade. The pain is far from evenly distributed: credit card delinquencies have hit levels not seen since 2011, auto loan defaults are approaching post-crisis highs, and student loan delinquencies have spiked to 16.3% following the end of pandemic-era forbearance. The stress is concentrated among lower-income ZIP codes, younger borrowers, and markets where home values are stalling or declining, which are historically the canary-in-the-coal-mine segments for broader housing disruption.
Na Zhao of the National Association of Home Builders (NAHB) reveals the stark math behind America’s affordability crisis through NAHB’s 2026 housing affordability pyramid, showing that 52% of U.S. households, roughly 70 million, cannot afford a $300,000 home, let alone the estimated $410,000 median price of a new home this year. The pyramid’s base tells the most sobering story: at a 6% mortgage rate, a household needs at least $55,500 in income to purchase a $200,000 home, and approximately 47.5 million households fall at or below that threshold. Another 22.4 million can stretch only to the $200,000 to $300,000 range, meaning the vast majority of American households are priced out of new construction entirely, with each step up the pyramid shrinking dramatically as prices climb toward $2.5 million and beyond.
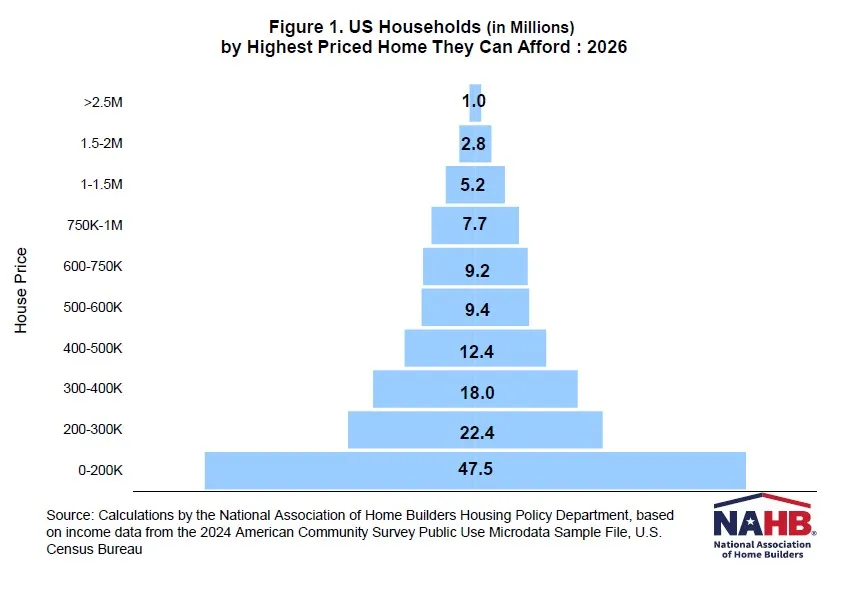
Source: NAHB (March 2026)
Dana Anderson of Redfin reports that mortgage rates have fallen to 6.01%, their lowest since September 2022, pushing the median monthly housing payment down to $2,599 and handing buyers an extra $34,000 in purchasing power compared to last year. Yet buyers aren’t biting: pending home sales dropped 5.5% annually through the four weeks ending February 22, the steepest decline in over a year, while new listings slipped 2.8%. Rising home prices (up 1% year over year), economic jitters over layoffs and stock market volatility, and an unusually harsh winter are keeping would-be buyers firmly planted on the sidelines heading into spring.
Similarly, Kara Ng of Zillow reports that a median-income U.S. household can now afford a $331,483 home, a $30,302 jump from last year and the highest level since March 2022, thanks to mortgage rates dropping from 6.96% to 6.10% and incomes edging higher. That boost has opened up roughly 82,300 additional homes for the typical household budget, though affordability remains stretched with mortgage payments still eating 32.3% of median income. The biggest gains are concentrated in pricey metros, with San Jose buyers picking up nearly $74,000 in purchasing power, followed by San Francisco ($56,115), Washington, D.C. ($48,881), San Diego ($46,506), and Boston ($46,390).
GDP data
Jeff Cox of CNBC reports that U.S. GDP grew at just 1.4% in the fourth quarter of 2025, badly missing the 2.5% Dow Jones estimate, with the Commerce Department pointing to the record-length government shutdown as a key drag that shaved roughly 1 percentage point off growth. Full-year 2025 growth came in at 2.2%, down from 2.8% in 2024, while inflation held stubbornly at 3% on the Fed’s preferred gauge. The weak print drew sharp reactions from President Trump, who blamed the shutdown for the miss and renewed his attacks on Fed Chair Jerome Powell for not cutting rates more aggressively.
James Picerno of Seeking Alpha argues that Q4’s disappointing 1.4% GDP print looks more like a one-off stumble than a trend, with the government shutdown shaving roughly 0.9 percentage points off headline growth and masking what would have been a low-2% quarter. Early Q1 nowcasts already tell a different story: the Atlanta Fed’s GDPNow model projects 3.1% growth for the first three months of 2026, while the New York Fed’s estimate is more modest at 2.4%. The Dallas Fed’s Weekly Economic Index reinforces that optimism, climbing to 2.58 through mid-February, its highest reading since August and above the pace of full-year 2025 GDP growth.
Jesse Wade of NAHB notes that housing’s economic footprint continues to shrink, with its share of GDP falling to 16.0% in Q4 2025, down from 16.3% a year earlier, as residential fixed investment subtracted from real GDP growth in every quarter of 2025, echoing a pattern last seen in 2022. The homebuilding and remodeling component slipped to just 3.7% of GDP, well below its historical average of roughly 5%, while the housing services side held steady at 12.3%, highlighting a growing disconnect between the stable consumption side of housing and the increasingly challenged construction side.
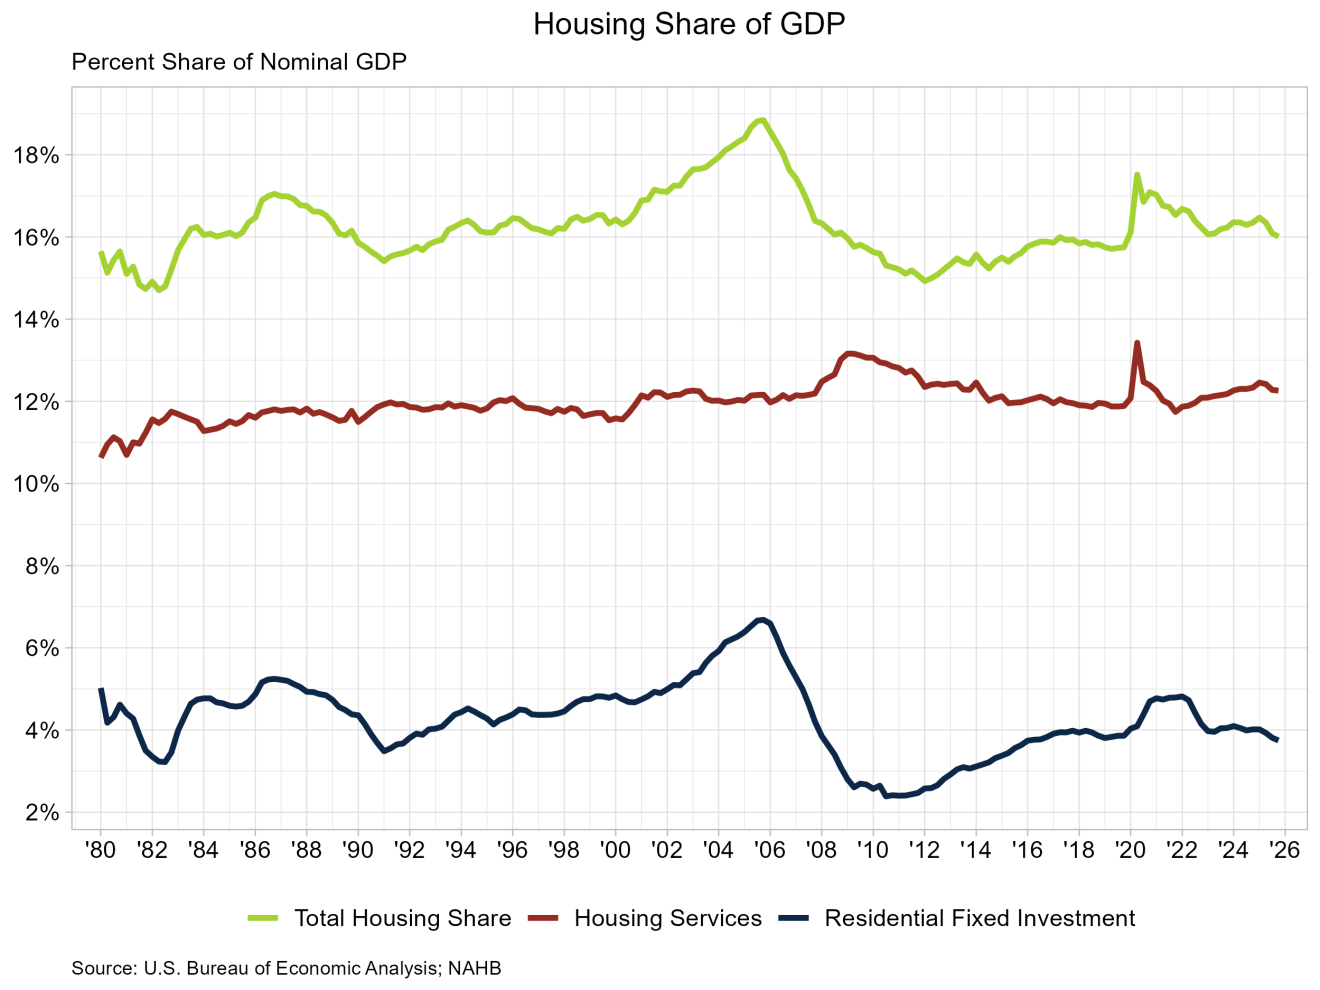
Source: NAHB (March 2026)
Neil Irwin of Axios zeros in on what was actually working beneath Q4’s soft headline, noting that consumer spending contributed 1.6 percentage points to growth, while the AI investment boom added another 0.82 points, driven by information processing equipment and software alone. Federal spending, meanwhile, cratered at a 16.6% rate, dragging GDP down by 1.15 percentage points during a quarter where the government was shuttered for roughly half the period. The real tell may be in the underlying demand signal: real final sales to private domestic purchasers grew at a 2.4% annual rate, suggesting the private economy is still humming even as Washington’s dysfunction weighs on the topline numbers.