
Danielle Hale of Realtor.com reports that existing home sales rose 5.1% in December 2025 to a 4.35M annualized pace, 1.4% higher than a year ago, helped by lower mortgage rates and a minor November revision to 4.14M. Even so, 2025 sales totaled 4,061,000 vs. 4,062,000 in 2024, the lowest year since 1995 by just 1,000 homes. Prices stayed firm with the median up 0.4% to $405,400, while supply tightened as months of inventory fell to 3.3 (seasonally adjusted 3.8).
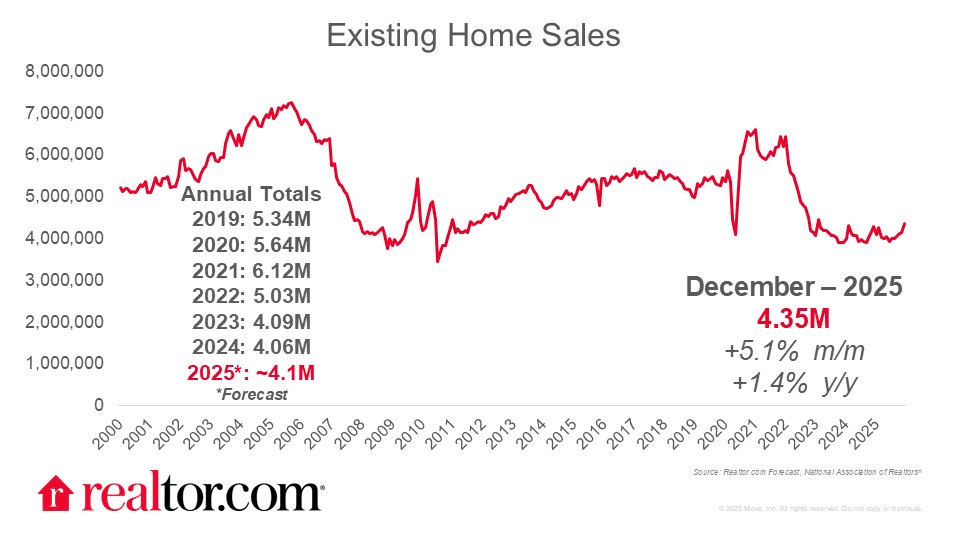
Source: Realtor.com (January 2026)
Regionally, December sales rose most in the South (+6.9%) and West (+6.6%), and price gains were strongest in the Northeast (+3.7%) and Midwest (+3.1%), where inventories still trail pre-pandemic levels by a third or more.
Orphe Divounguy of Zillow argues the headline isn’t December’s 5.1% jump, but that 2025 sales still “stayed stuck near the bottom”, with full-year existing-home sales at ~4.06M, roughly matching the prior year despite better affordability. Divounguy highlights the demand-supply mismatch: inventory ended December at 1.18M units, down 18.1% month over month but up 3.5% year over year, while prices were basically unchanged, with a $405,400 median and +0.4% YoY.
Lily Katz of Redfin reports that pending home sales fell 5.9% month over month in December to the lowest seasonally adjusted level on record, aside from April 2020, according to Redfin data going back to 2012. The drop was the largest since September 2022, and pending sales were down 7.4% year over year, as buyers stayed skittish amid housing-cost pressure and broader uncertainty, even as mortgage rates eased but remained above 6%. Despite softer demand, prices remained elevated, with the median sale price up 0.5% YoY to $428,742, the highest December level on record, while the typical home that did sell took 60 days to go under contract, the slowest December pace in a decade.
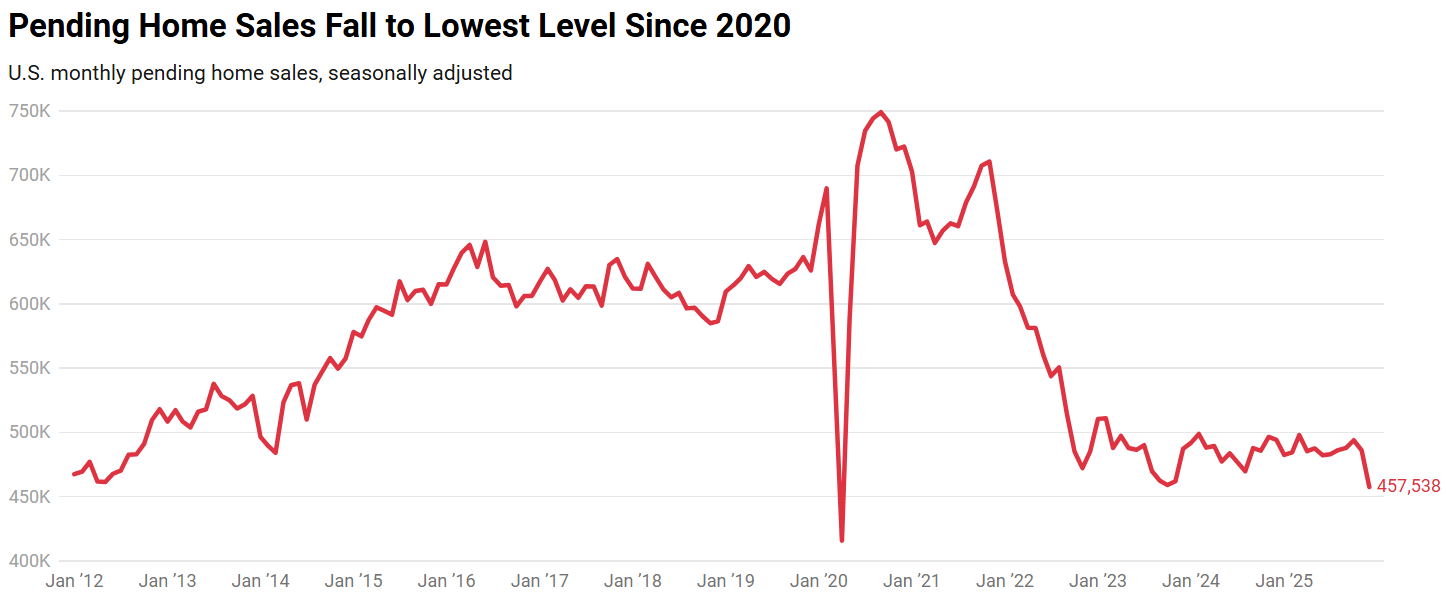
Source: Redfin (January 2026)
Fan-Yu Kuo of the National Association of Home Builders (NAHB) notes that while December existing-home sales jumped 5.1%, the fastest pace since February 2023, the bigger story is that 2025 still ended at a 30-year low, with 4.06M sales, matching 2024 and tying the lowest level since 1995. Inventory stayed the constraint: 1.18M units in December, down 18.1% from November, translating to just 3.3 months of supply (vs. 4.2 in November), well below the 4.5–6 months typically seen as balanced, which helped keep prices firm with a $405,400 median, +0.4% YoY, and the 30th straight month of annual increases.
Kara Ng of Zillow reports that homebuying affordability is improving across the U.S., with Zillow forecasting that 20 of the 50 largest metros will be affordable to buy in by the end of 2026, the most since 2022, driven by a mix of slow home price growth, easing mortgage rates, and rising incomes. While affordability is improving, mortgage payments still consume 32.6% of median household income nationally, down from the all-time low in October 2023 (38.2%), and monthly costs are now $177 lower than their October 2023 peak. Zillow expects this improvement without a price crash, projecting home values will rise 1.9% in 2026 and increase in 41 of the 50 largest metros, with affordability expected to further improve to 31.8% of median income by year-end.
Diana Olick of CNBC reports that mortgage demand jumped as rates fell, after a Trump social media post about directing Fannie Mae and Freddie Mac to buy $200 billion in mortgage-backed bonds briefly pushed the 30-year fixed rate below 6% on Friday morning (per Mortgage News Daily). The Mortgage Bankers Association said total mortgage application volume rose 28.5% week over week (holiday-adjusted), while the average contract rate on 30-year conforming loans up to $832,750 eased to 6.18% from 6.25%, with points dipping to 0.56 from 0.57 (with a 20% down payment). Purchase applications increased 16% for the week and were 13% higher than a year earlier, though rates edged slightly higher at the start of the following week.
Foreclosure update
ATTOM Data Solutions reports that U.S. foreclosure activity rose in 2025 as the market continued to normalize: 367,460 properties had foreclosure filings, up 14% from 2024 and up 3% from 2023, but still down 25% from 2019 and down 87% from the ~2.9M peak in 2010. Those filings touched 0.26% of U.S. housing units in 2025, slightly above 0.23% in 2024 and well below 0.36% in 2019 and the 2.23% peak in 2010, with ATTOM’s CEO framing the increase as a recalibration rather than broad homeowner distress given more substantial equity and tighter lending.
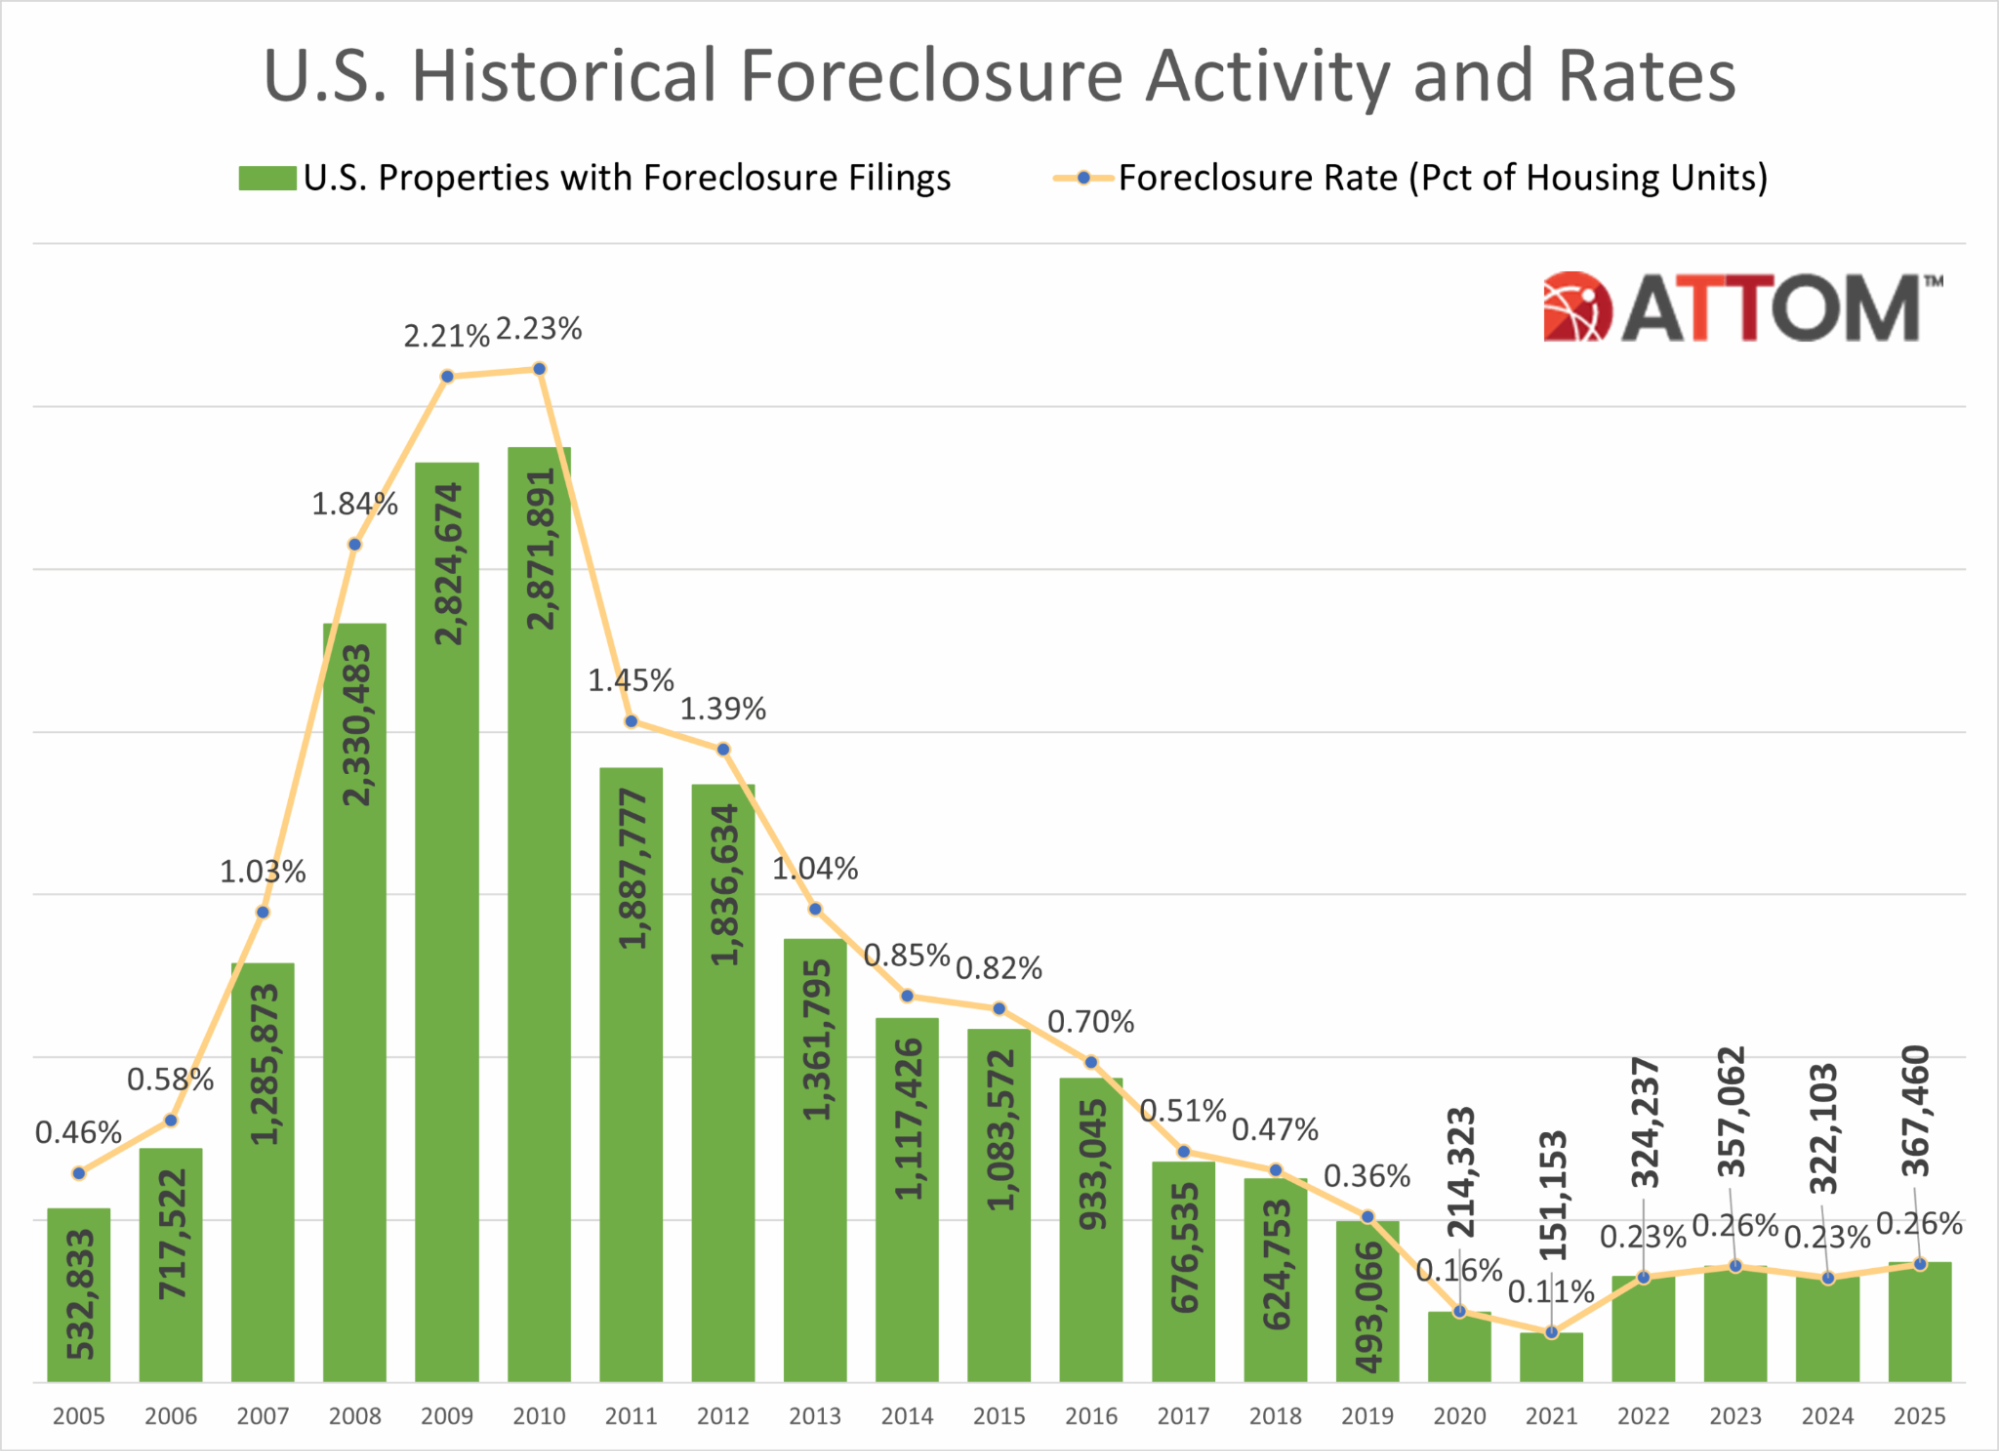
Source: ATTOM (January 2026)
The report also flags acceleration late in the year, with 44,990 properties filing in December 2025, up 26% from the prior month and 57% year over year. Foreclosure starts totaled 289,441 in 2025, up 14% from 2024 and up 213% from the 2021 low, led by Texas (37,215) and Florida (34,336), while bank repossessions (REO) reached 46,439, up 27% year over year but still down 68% from 2019 and down 96% from 2010, with the most REOs in Texas (5,147) and California (4,030).
Megan Hunt, also of ATTOM, zooms in on where the December 2025 foreclosure uptick is concentrated, showing a broad-based rise across states but with the highest foreclosure rates clustered in the Mid-Atlantic and Southeast: nationally, 1 in every 3,163 housing units had a filing in December, and the worst state rates were New Jersey (1 in 1,734; 2,178 filings), South Carolina (1 in 1,917; 1,253), Maryland (1 in 1,961; 1,298), Delaware (1 in 2,044; 224), and Florida (1 in 2,119; 4,757).
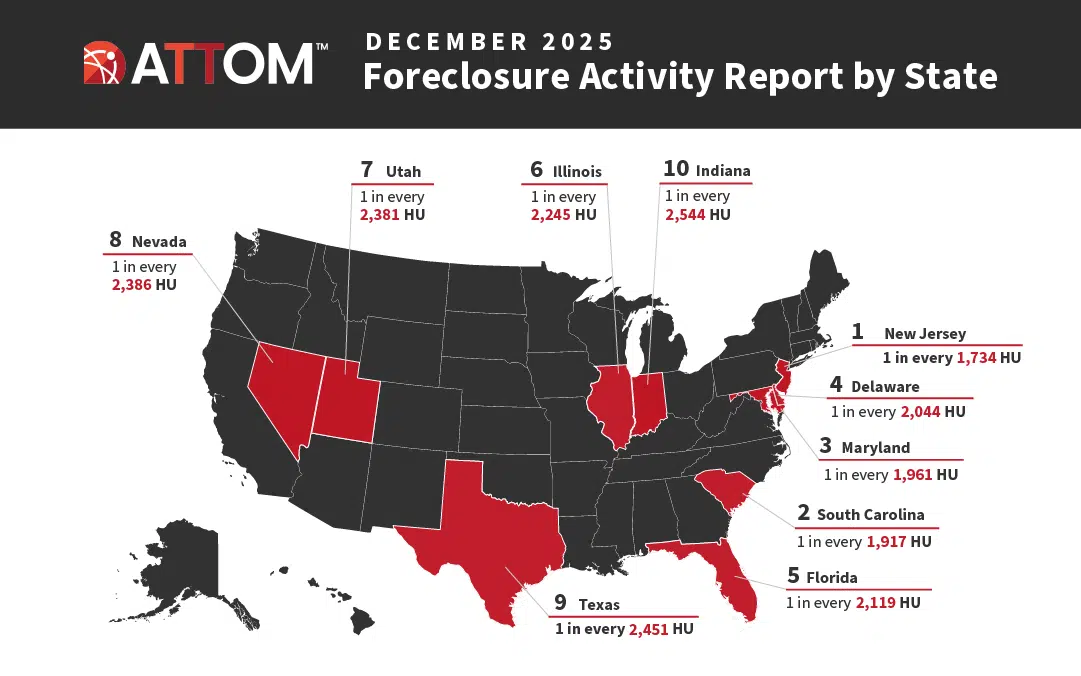
Source: ATTOM (January 2026)
Hunt also highlights that the surge wasn’t just filings but pipeline movement, with foreclosure starts up 19% month over month to 28,269 and REO completions up 53% to 5,953, and especially sharp year-over-year jumps in both (+46% starts, +101% REOs), alongside hotspots within those states like Salem/Camden/Cumberland/Gloucester (NJ) and Taylor/Charlotte/Osceola/Citrus (FL).
Realtor.com senior economic research analyst Hannah Jones comments on the data:
“Florida leads the nation in filings, as homeowners there face heightened affordability pressures from rising insurance premiums, property taxes, and overall ownership costs…Growing home supply has softened demand in parts of the state, contributing to slower price growth and longer time on market. Together, these dynamics increase the risk of foreclosure for some homeowners, particularly those who bought near the peak of the market or are carrying higher monthly costs.”
Commercial real estate
Diana Olick of CNBC reports that U.S. commercial real estate deal-making cooled again in November, with transaction volume down 10% year over year and just 1,800 total deals in Moody’s tracking of the top 50 U.S. property sales across major sectors. Even as overall activity slipped to below November 2020 levels, buyers concentrated at the top end: deals over $100M were up 51% YoY, lifting the average deal size to $14.2M versus about $12M since early 2019, and most top transactions were Class A assets. By sector, multifamily led with 20 deals, followed by office (11) and industrial (8), while office pricing continues to reset through specialty-use purchases, conversion plays, and discounted trades.
CBRE’s U.S. Real Estate Market Outlook 2026 forecasts U.S. GDP growth slowing to 2.0% with inflation averaging 2.5%, yet expects CRE investment activity to rise 16% to $562B in 2026, nearly back to the pre-pandemic (2015–2019) annual average, with returns largely income-driven and cap rates compressing 5–15 bps. Leasing is projected to recover from its 2024 low, with office splitting sharply between scarce prime space and older product, industrial continuing a flight to quality, retail demand led by grocery/discount/services, multifamily supported by positive net demand but weighed down by unleased new supply (notably Sun Belt/Midwest), and data centers set for record leasing amid power delivery constraints.
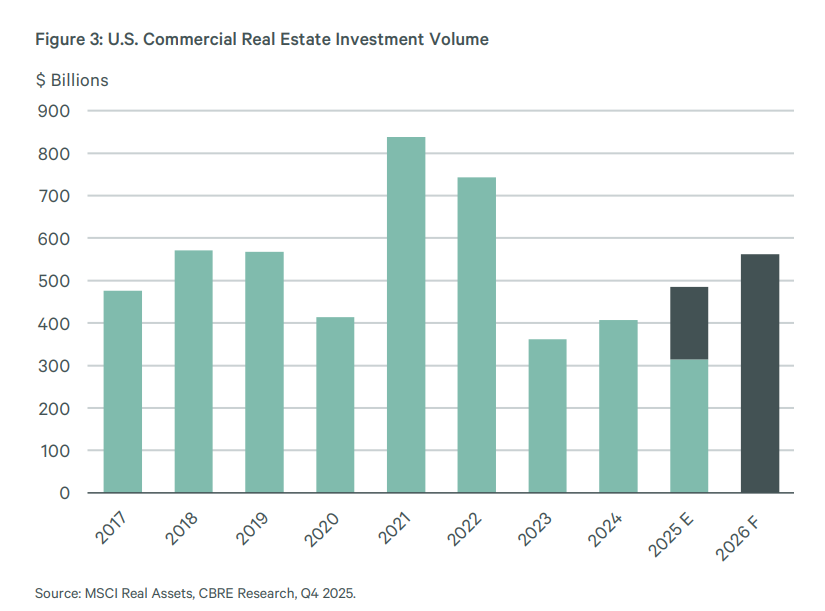
Source: CBRE (January 2026)
Philippa Maister of Globe St writes that CBRE’s 2026 outlook sees multifamily stuck in recovery mode, with low rent growth, landlords prioritizing occupancy and concessions, and vacancy expected to rise from 4.4% as demand lags supply, especially in overbuilt Sunbelt and Mountain markets. High home prices help keep renters in place, including a cited 105% premium to buy versus rent, but a weak job market limits new household formation; with renewals making up 57% of leasing activity, owners are leaning on historically strong renewals while offering incentives to fill new leases.
Erik Sherman, also of Globe St, reports that Chandan Economics and Arbor Realty Trust estimate U.S. multifamily rental households hit a record 22.0 million in 2024 and likely climbed to 22.4 million in 2025, adding about 372,944 new renter households if recent growth held. That’s a sharp rebound from 19.4 million in 2020, implying roughly 3 million more multifamily renter households over five years, a 15.4% jump versus 5.3% growth in total U.S. households, the biggest five-year increase in over two decades. The primary driver is affordability: the national median home sale price rose from $317,100 (Q2 2020) to $410,800 (Q2 2025), up 29.5%, pushing more households to rent as buying slips further out of reach.
Finally, Paul Bubny of ConnectCRE reports that outstanding commercial and multifamily mortgage debt rose 1.1% ($53.4B) in Q3 2025 to $4.93T, with multifamily debt driving the increase, up $40.3B (1.8%) to $2.24T. Reggie Booker notes agencies and GSEs again led growth despite uncertainty, while banks and life insurers also increased holdings. By holder, commercial banks remain the largest at $1.8T (37%), followed by agency and GSE portfolios plus MBS at $1.11T (23%), life insurers at $783B (16%), and CMBS/CDO/other ABS at $642B (13%).