

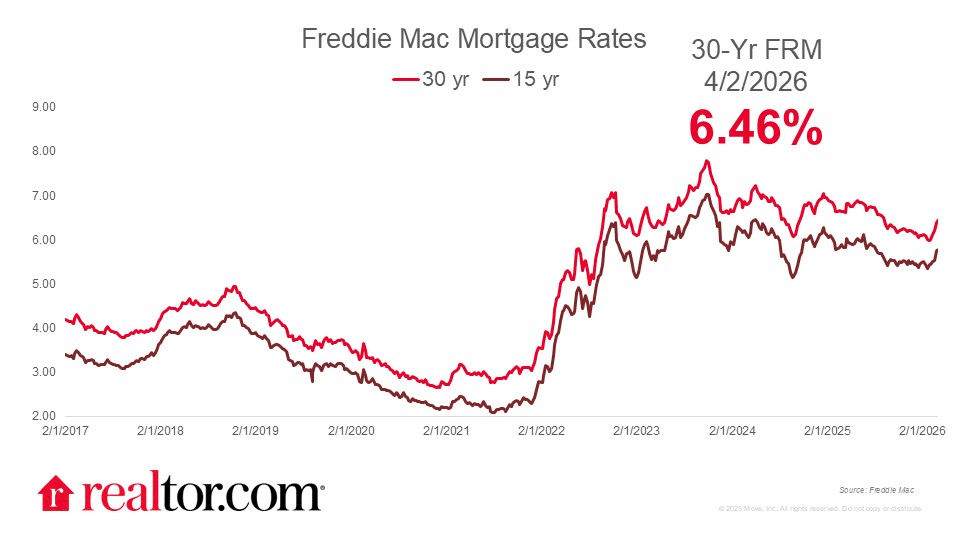
Hannah Jones of Realtor.com reports that the Freddie Mac 30-year fixed mortgage rate rose for a fifth straight week, climbing 8 basis points to 6.46%, its highest level in seven months, amid ongoing conflict in Iran that is shaking financial markets. The rate increase adds roughly $115 per month to a buyer’s payment compared to just a month ago (based on 10% down at March’s median home price), which could sideline more buyers heading into the spring market. On the pricing side, home values were flat or declining year over year in 34 of the 50 largest U.S. metros, a sign that sellers are recalibrating expectations and buyers in many markets have more negotiating leverage than they’ve had in years.
Source: Realtor.com (April 2026)
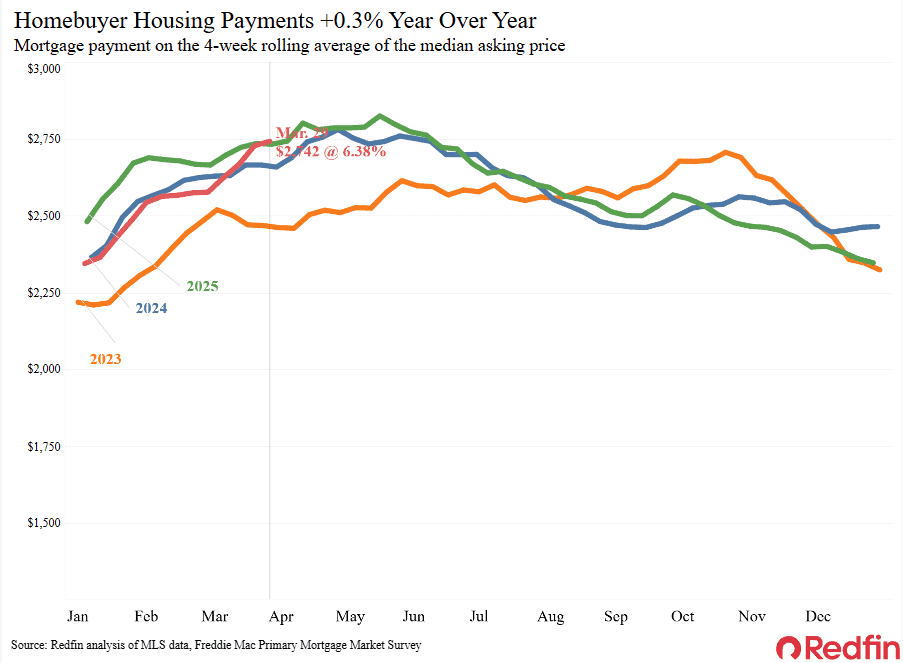
Dana Anderson of Redfin reports that the median monthly mortgage payment rose to $2,742, up 0.4% year over year, the first increase in nearly six months. Daily average rates climbed as high as 6.64% at the end of last week, while the weekly average 30-year fixed rate hit 6.38% (week ending March 26), the highest in six months. Iran war tensions and rising oil prices are a major factor pushing rates higher. Some would-be buyers are backing off amid high costs and broader uncertainty.
Source: Redfin (April 2026)
Logan Mohtashami of HousingWire noted that mortgage rates ended the week at a yearly high of 6.64%. Weekly pending sales came in at 70,209 (vs. 69,183 in 2025), with six consecutive weeks of positive yearly growth, though growth slowed last week. Housing inventory rose from 705,633 to 713,549 in the week of March 21-28, down sharply from 33% YoY inventory growth at peak in 2025 to just 5.69% last week. The 10-year yield hit an intraday high of 4.48% last Friday due to Iran escalation, with mortgage spreads closing at 2%.
Catherine Koh of the National Association of Home Builders (NAHB) takes a broader look at the recent rate reversal, noting that the 30-year fixed mortgage averaged 6.18% in March, up 13 basis points from February after briefly dipping below 6% earlier in the year. The 15-year rate followed a similar path, rising 13 basis points to 5.56%. Still, both rates remain lower than a year ago by 47 and 27 basis points, respectively. The culprit behind the climb is the 10-year Treasury yield, which jumped 11 basis points to 4.24% as the Iran conflict disrupted oil markets and reignited inflation fears. The Fed, for its part, held steady at 3.5% to 3.75% but revised its inflation forecast upward from 2.4% to 2.7%, while still signaling that one rate cut remains on the table for 2026.
Mike Fratantoni, the Mortgage Bankers Association’s (MBA) Chief Economist, comments:
“The 30-year mortgage rate, now at 6.57 percent, reached its highest level since last August and is up half a percentage point from just one month ago. Refinance application volumes declined sharply again last week, dropping 17 percent, and are down more than 40 percent compared to last month…Seasonally adjusted purchase application volume also declined over the week, but only by 3 percent. The headwinds of higher rates are being offset somewhat by the buyer’s market in many parts of the country – there are more homes for sale than buyers have seen in some time. Moreover, purchase applications for FHA and VA loans continue to hold up better than those for conventional buyers. However, the shocks of the jump in rates and the increase in overall economic uncertainty are likely having an impact on buyer confidence.”
Housing market signals
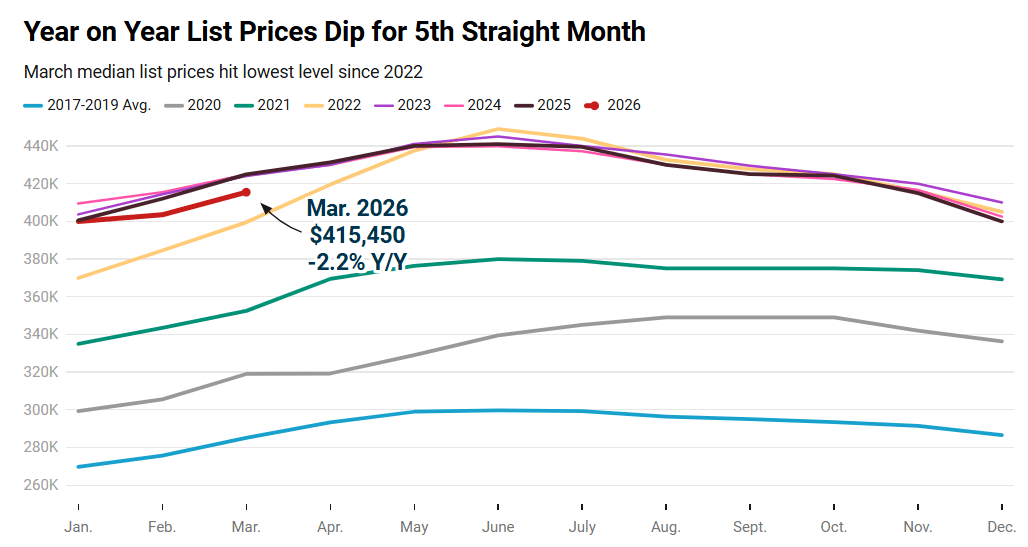
Jake Krimmel of Realtor.com reported that the median home listing price fell to $415,450 in March, down 2.2% year over year, the fifth consecutive monthly decline. Active listings rose to 964,477, up 8.1% YoY (29 straight months of gains), though still 13.8% below 2017-19 levels. Median days on market hit 57, up 4 days year over year. Prices were flat or falling in 34 of the top 50 markets, while pending sales were up 3.9% YoY as sellers priced more realistically.
Source: Realtor.com (April 2026)
“Year-over-year changes in median list prices by region ranged from -3.6% in the Northeast to -0.1% in the Midwest. When adjusting for changing home sizes, price per square foot, prices rose more robustly in the Midwest (+1.4) and Northeast (+0.4%) compared to the South (-3.5%) and West (-1.4%). At the metro level: Median list price per square foot is falling in 31 of the top 50 metros. The largest per-square-foot price declines were in Austin (-7.1%), Memphis (-6.3%), and San Antonio (-4.6%). The largest gains were in Providence (+9.8%), Indianapolis (+6.3%), and Milwaukee (+5%).”
Source: Realtor.com (April 2026)
Jiayi Xu, also of Realtor.com, reported that active inventory rose 5.7% year over year in the week ending March 28. The median listing price fell 1.2% YoY – the 23rd consecutive week of flat or negative price growth – while price per square foot fell 2.2% YoY. Median days on market stood at 54, two days longer than a year ago. Year-to-date new listings are 1.6% below 2025 levels, pointing to a still-constrained supply pipeline despite rising active inventory.
Megan Hunt highlights fresh data from ATTOM’s Q1 2026 U.S. Home Affordability Report, shifting the focus from rates to what homeownership actually costs relative to wages. Nationally, major monthly costs on a median-priced home consumed 30.3% of the average worker’s wages, down slightly from 30.6% last quarter and 31.6% a year ago. But that modest improvement masks sharp regional divides: 69.1% of the 580 counties analyzed exceeded the standard 28% affordability threshold, and nearly a quarter (24.8%) crossed the 43% mark considered seriously unaffordable. Orange County, CA topped the most burdened list at a staggering 88.1% of typical wages, followed by Los Angeles County at 66% and San Diego County at 65.7%. On the flip side, Texas metros offered the most breathing room, with Harris County requiring just 21.2% of wages and Bexar County at 27.3%, while Cook County, IL came in at 25.1%.
Jobs report
Jake Krimmel or Realtor.com notes that March’s jobs report offered a welcome surprise, with 178,000 nonfarm payrolls added and unemployment dipping to 4.3%, but cautions against reading too much into the headline. February was revised sharply lower to negative 133,000 net job growth, and much of March’s survey window predates the worst war-related economic disruption. Taken together, the three-month rolling average sits at just 68,000 jobs, leaving the line between a stabilizing and stagnating labor market razor-thin heading into the spring housing season.
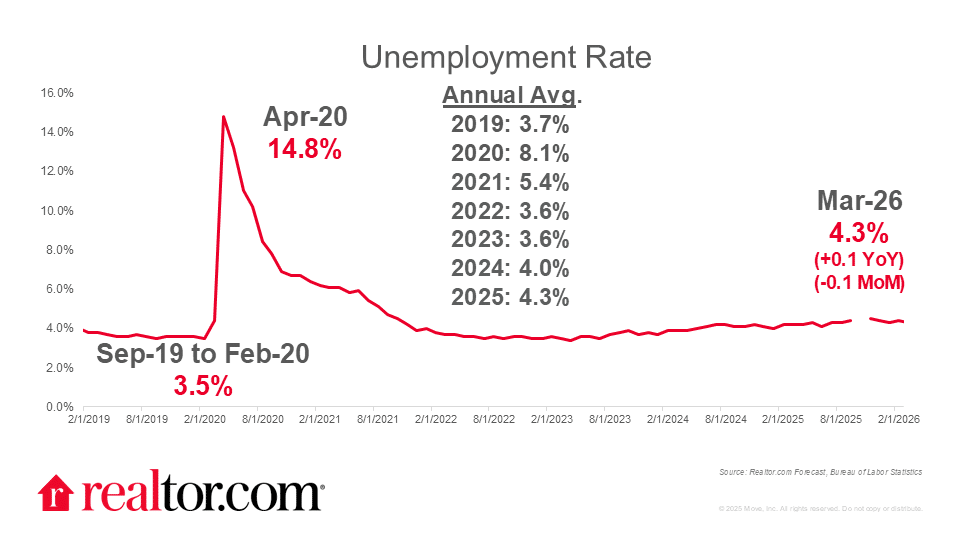
Source: Realtor.com (April 2026)
“For housing, the report renews some hope heading into April after a turbulent March. Construction added 26,000 jobs, a potential leading indicator for housing supply and demand as the season ramps up. The broader labor market picture won’t boost consumer confidence much, but it probably won’t make it worse either. This is extremely important given that mortgage rates have risen for five straight weeks and are now pushing 6.5%.”
Orphe Divounguy of Zillow digs beneath the March payroll rebound to highlight a household survey that paints a more troubling picture for housing. The civilian labor force shrank by 396,000 in March, participation slipped to 61.9%, and the employment-to-population ratio fell to 59.2%, well below its 2023 peak of 60.4%. Discouraged workers rose by 144,000 to 510,000, meaning the drop in unemployment to 4.3% partly reflects people leaving the workforce rather than finding jobs. Wage growth also cooled, with average hourly earnings slowing to 3.5% year over year from 3.8% in February, while the average workweek shortened.
“March’s payroll rebound is encouraging on the surface, but the broader labor market still looks stalled. Job growth has changed little on net over the past year, and the recent pattern of downward revisions points to weaker momentum than the headlines suggest. Weakening inflation-adjusted wages and higher yields are undoing the recent affordability gains. The unemployment rate remains low, but part of that reflects weaker labor-force attachment. When more people become discouraged or step out of the labor force, that is not the kind of labor-market strength that fuels housing turnover.”
Jing Fu of NAHB zeroes in on construction employment specifically, where the sector added 26,000 jobs in March after a revised loss of 13,000 in February. Residential construction accounted for 14,300 of those gains, bringing total employment to 3.3 million workers. A notable turning point: the six-month moving average for residential construction job gains flipped positive at 800 per month, ending a 14-month streak of negative readings.
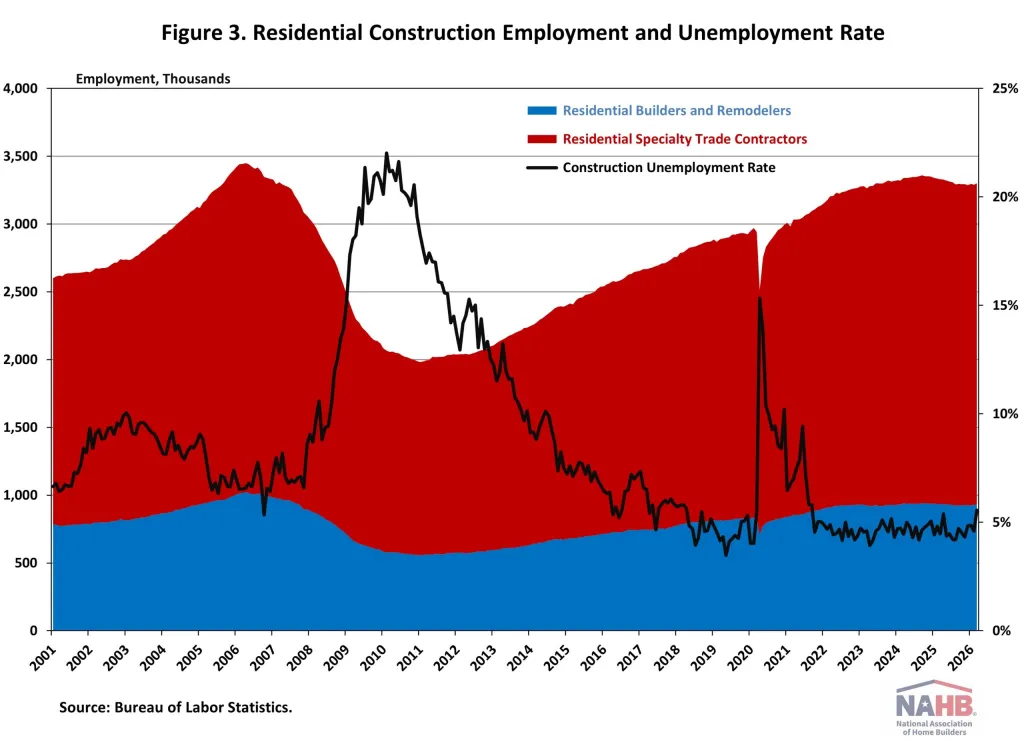
Source: NAHB (April 2026)
Still, the longer view is sobering, as the sector has shed a net 29,300 jobs over the past 12 months, marking its thirteenth consecutive annual decline and the longest such streak since the Great Recession. Construction worker unemployment ticked up to 5.6% in March, relatively low by historical standards but another signal that the building side of housing remains in a fragile recovery.