
Lucia Mutikani of Reuters reports that the U.S. labor market showed mixed signals in September: nonfarm payrolls grew by 119,000 jobs (well above forecasts) after August was revised to a 4,000 job loss, yet the unemployment rate rose to 4.4%, its highest in four years. Healthcare drove gains with 43,000 new jobs, followed by restaurants and bars with 37,000, while transportation and warehousing lost 25,000, and manufacturing shed 6,000. The data, delayed by a 43-day government shutdown that also canceled the October report, leaves policymakers without another employment update before the December Fed meeting.
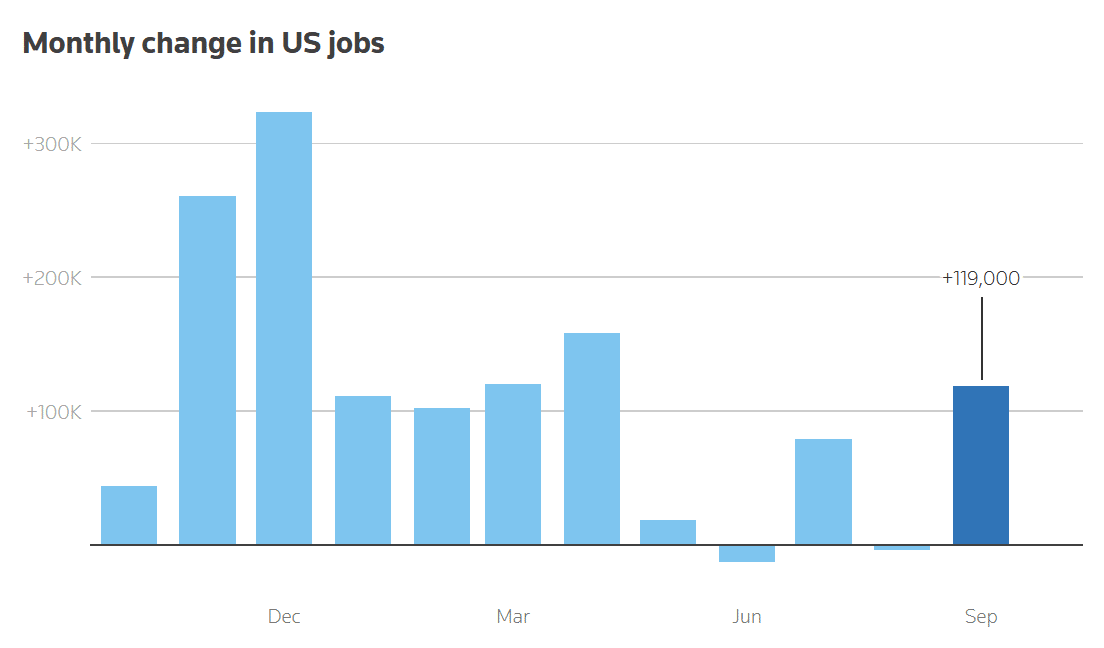
Source: Reuters (November 2025)
Emma Ockerman of Yahoo! Finance highlights that September’s 119,000 job gain offered a surprising upside in an otherwise cooling labor market. Still, the story’s sharper edge comes from the broader signs of strain: unemployment rose to 4.4%, the highest since 2021, and the number of unemployed Americans climbed to 7.6 million. Even with 3.8% annual wage growth outpacing 3% inflation, private-sector indicators painted a weaker backdrop—ADP reported 29,000 private-sector job losses, and Challenger tracked the lowest hiring plans since 2009. Government employment also continued to retreat, now 97,000 jobs below its January peak.
Jake Krimmel of Realtor.com emphasizes that September’s job gains and rising unemployment rates stand at a pivotal moment for housing, as this is the last labor data the Fed will see before its December meeting, which will directly influence the path of mortgage rates. A slightly softer labor market increases the likelihood of a December rate cut, which could provide mild affordability relief and help mitigate the seller lock-in effect heading into the 2026 spring market.

Source: Realtor.com (November 2025)
However, the upward drift in unemployment and downward revisions to prior months also raise caution: continued softening could dampen buyer confidence, while stable job growth paired with easing inflation could boost real purchasing power. Ultimately, the report keeps the housing outlook tethered to two swing factors: how quickly rates fall and whether the labor market stabilizes or weakens from here.
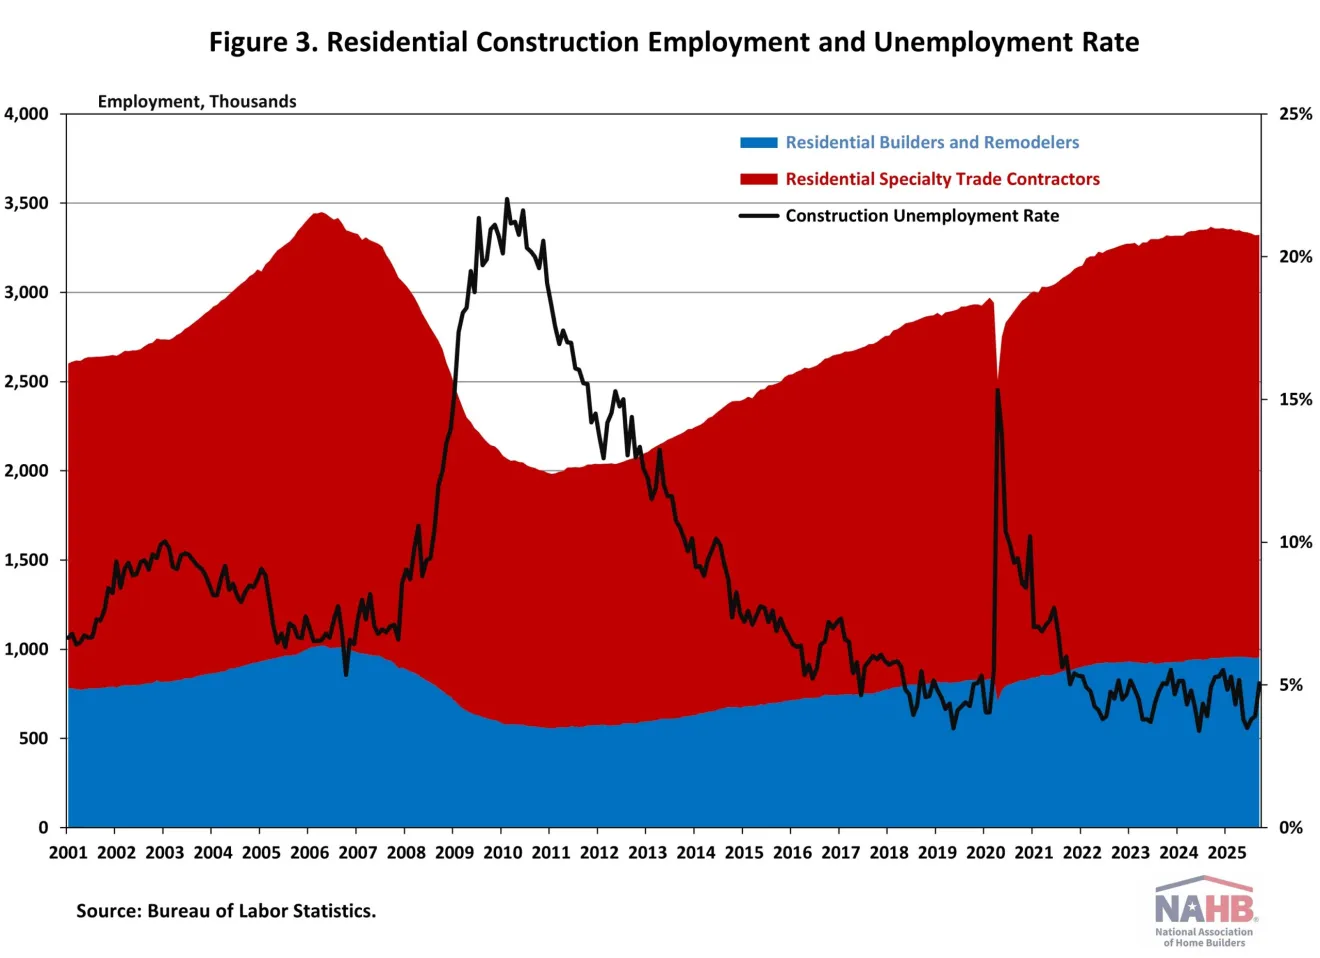
Jing Fu of the National Association of Home Builders (NAHB) underscores that September’s 119,000 job gain masks a cooling in the labor market, one with direct implications for housing construction, where the sector finally added 19,000 jobs after three straight months of losses. Residential construction saw only a modest 3,100-job increase. Despite this bump, the six-month moving average for residential employment remains negative, with the industry shedding 44,900 jobs over the past year, its fifth straight annual decline.
Source: NAHB (November 2025)
Fu notes that while residential construction employment still totals 3.3 million workers, including 954,000 builders/remodelers and 2.4 million specialty trade contractors, the sector’s recovery remains uneven. Rising construction-worker unemployment (now 5.1%) adds further pressure, suggesting ongoing labor shortages, cost challenges, and slower build pipelines. With the Fed relying on this report ahead of its December meeting, the combination of softening labor momentum and fragile construction employment reinforces the risk of slower housing supply growth heading into 2026.
Home sales
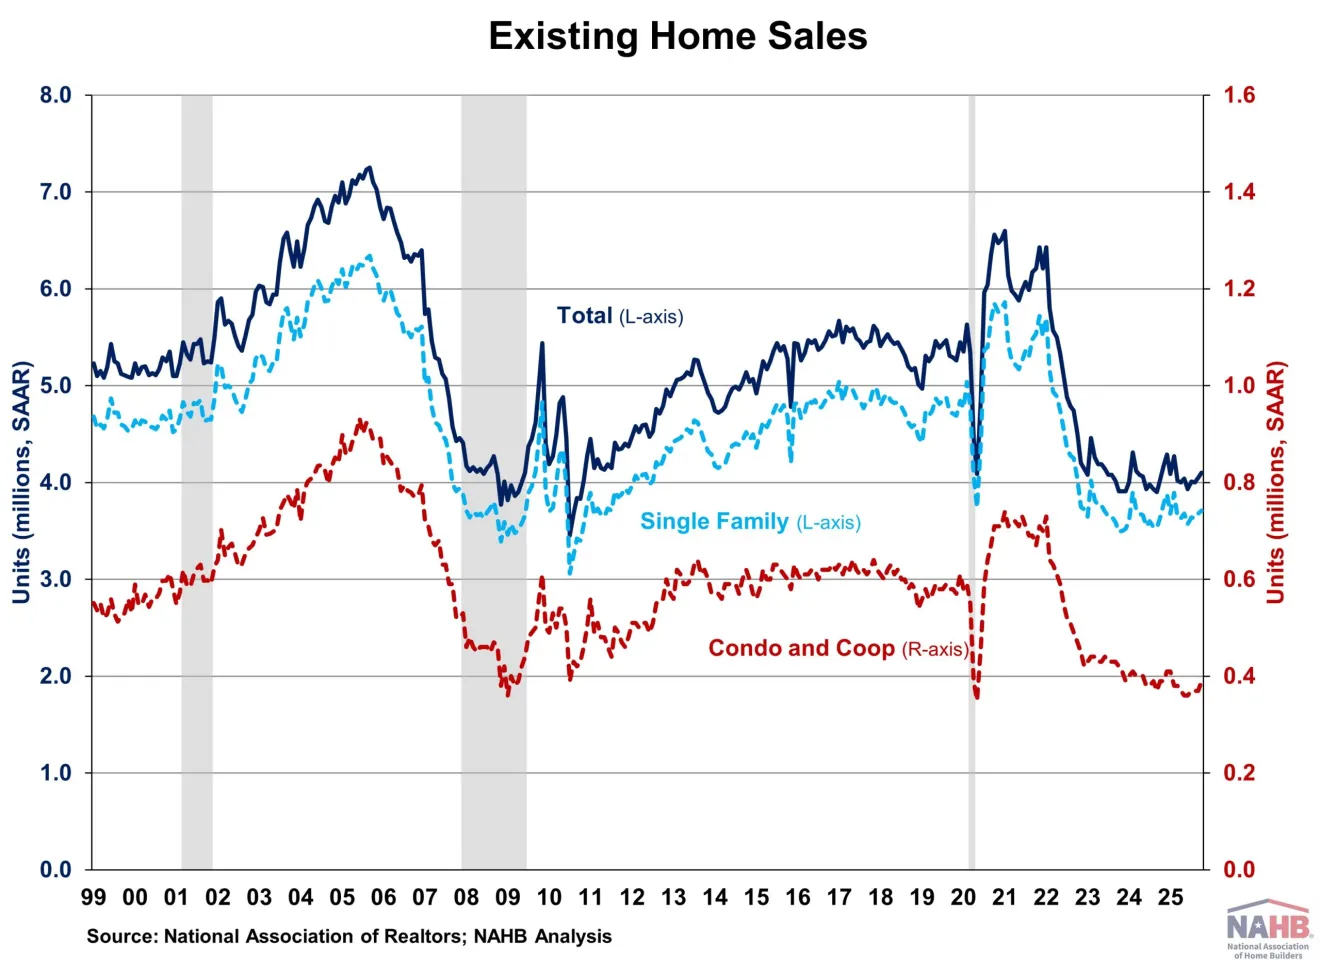
Fan-Yu Kuo of NAHB reports that October existing home sales climbed 1.2% to 4.10 million (an eight-month high) as falling mortgage rates reopened the market for more buyers. Rates have dropped to 6.17%, their lowest level in over a year, after the Fed resumed cuts in September, helping to push inventory 10.9% higher year-over-year to 1.52 million units, despite supply remaining well below pre-pandemic norms.
Source: NAHB (November 2025)
Logan Mohtashami of HousingWire highlights a different but crucial dynamic: the return of steady seasonality to the housing market after several years of volatility. With mortgage rates holding below 6.64% for 16 straight weeks, demand patterns are behaving more predictably, allowing metrics like total pending home sales, now at a multiyear high for this calendar week, and weekly pending sales (58,612 vs. 55,862 last year) to track more “normally” with rate movements. Purchase applications reflect the same rhythm: despite a slight 2% weekly dip, they’re up 26% year over year, marking 42 consecutive weeks of positive YOY growth.
Meanwhile, stabilizing bond markets have kept the 10-year yield within a tight 4.05%–4.15% band and pushed mortgage spreads to within 0.33 percentage points of historical norms. This is critical because spreads alone were what allowed rates to drift back toward the low-6% range. With inventory growth slowing from 33% YOY to 15.5% as seasonal listings taper, the story isn’t just rising demand, it’s the re-emergence of a more balanced, seasonally recognizable housing market heading into 2026.
Danielle Hale of Realtor.com comments on the sales data:
“Looking ahead, home shoppers in today’s market face some advantages from seasonally slower competition and lower mortgage rates, factors that dominated the October sales trend. At the same time, a lack of housing affordability continues to be a challenge keeping home sales in their historically low level. This has prompted the current administration to surface policy proposals such as a 50-year mortgage or portable mortgage. While these solutions are well-intended, they have significant drawbacks.”
Dana Anderson of Redfin points to a market defined by shrinking supply, not rising demand, as the key force behind the 2.3% jump in median U.S. home prices; the most substantial gain in seven months. Even as pending sales fell 0.8% year over year and homes now take 49 days to go under contract (the slowest pace since 2019), inventory growth is decelerating fast: active listings are up only 6.1%, the smallest increase since early 2024. That tightening supply is creating a split market. Eighteen of the 50 largest metros saw price declines (led by Fort Worth, Dallas, and Jacksonville), while Rust Belt and Midwest cities, such as Cincinnati (+10.5%), Pittsburgh, and Detroit, posted some of the nation’s most substantial gains.
Housing trends
Jake Krimmel of Realtor.com outlines the latest housing trends, showing a market slowly returning to pre-pandemic normalcy. With longer selling timelines, rising supply, and softening prices reshaping both buyer leverage and seller strategy, the market is gradually returning to its pre-pandemic state. Behind the headline numbers is a set of emerging trends that signal a more balanced (though still affordability-strained) market heading into 2026.
- Supply growth is being driven less by new sellers and more by stagnation: While new listings rose modestly (up 1.7% YoY), the bigger story is that homes are simply sitting longer, which is swelling active inventory to 1.1 million for the 29th straight week; an unusually long period of elevated supply by post-2020 standards.
- Time-on-market has normalized to pre-pandemic patterns: Homes now take a median of 64 days to sell (essentially the 2018–2019 norm), marking a definitive end to the hyper-fast market of the past few years and giving buyers breathing room to negotiate.
- Price momentum has finally cracked beneath the surface: The 0.4% YoY drop in median listing price is modest, but the deeper metric (price per square foot falling 1% YoY for the 11th straight week) signals underlying value softening that hadn’t shown up in headline price data until recently.
- Sellers are increasingly price-adjusting to chase demand: With homes lingering longer and fewer buyers willing to stretch, more sellers are cutting list prices earlier in the listing cycle, especially those hoping to transact before the slow winter months.
- Lower mortgage rates are improving sentiment, but not transaction volume: Rates in the low-6.2% range are encouraging some previously locked-in owners to test the market; yet, buyer demand remains muted enough that inventory growth is still driven by sluggish absorption, rather than a surge in listings.
Natalia Siniavskaia of NAHB reports that housing affordability pressures have reversed recent progress, with 32.5% of adults aged 18–34 living with their parents in 2024, up from 31.8% the previous year, and reaching over 40% in high-cost states such as New Jersey and Connecticut. Coastal markets such as California and Maryland also saw elevated rates near 39%, while more affordable regions (North Dakota (12%), D.C. (13%), and parts of the north-central U.S.) recorded the lowest shares. The data shows a strong link between high rental cost burdens and the likelihood of young adults staying at home, underscoring how strained affordability is reshaping household formation as the country heads into 2026.
Lily Katz and Asad Khan of Redfin note that housing affordability is deteriorating the fastest in rural America, where buyers now need to earn $74,508 to afford the typical home, a 106% increase from the pre-pandemic requirement of $36,206. Rural home prices have surged 60.5% to $280,900 while incomes have risen only 33%, creating a sharper affordability squeeze than in suburban and urban areas, where required incomes are up 91% and 88%, respectively. With rural incomes lagging and prices rising far faster than in metro markets, the affordability gap has widened dramatically, underscoring the uneven impact of the housing crisis across the country.
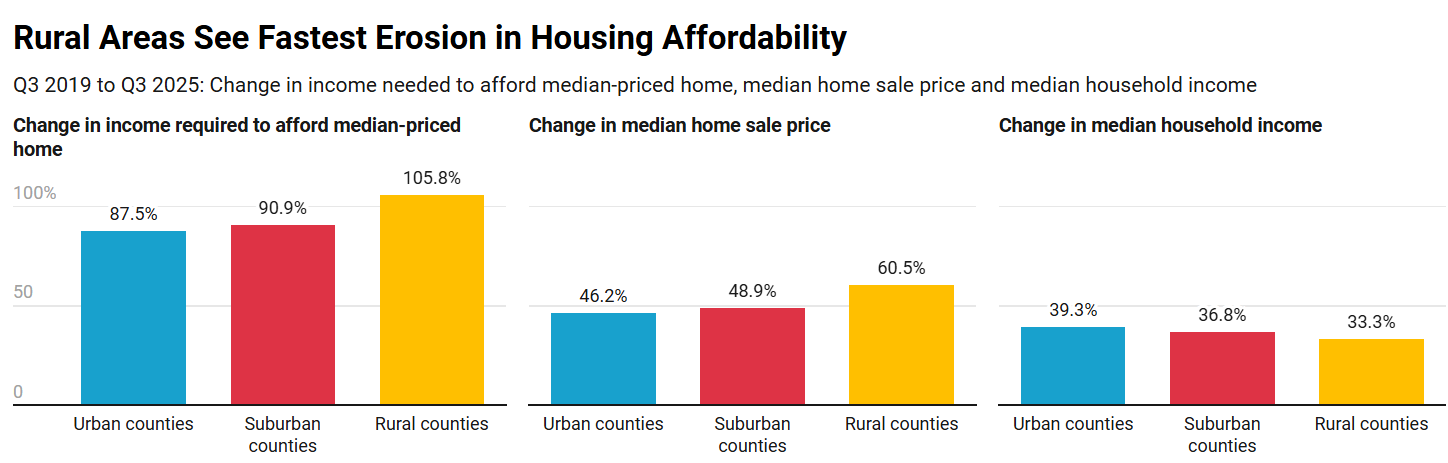
Source: Redfin (November 2025)
Finally, Megan Hunt of ATTOM reports that despite a broader national slowdown in home-purchase lending (down 4.8% quarter-over-quarter and 6.6% year-over-year) several metros are bucking the trend with sharp increases in purchase mortgage originations. ATTOM’s Q3 2025 data shows standout annual growth in markets like South Bend, IN (+51.7%), Indianapolis, IN (+51.4%), and Honolulu, HI (+45.9%), even as overall originations dipped to 765,667 nationwide. While total mortgage activity reached 1.77 million loans and $600.4 billion in volume, purchase loans now make up a slightly smaller share of the market (43.2% of originations), with refis and HELOCs driving what growth there is.