

Last Updated on November 11, 2025
A common mistake beginner rental property investors make is ball parking the vacancy rate. Using an inaccurate vacancy rate can cause significant errors in your revenue projections for rental property.
In this article, we’ll explain how to accurately calculate the vacancy rate for your market, if there is such a thing as a “normal” vacancy rate, and identify steps that every landlord can do to help keep vacancy rates under control.
What is the “Vacancy Rate” in a Rental Property?
The vacancy rate represents the percentage of time rental income is lost due to a property being unoccupied during the year. Real estate investors can also use vacancy rate to predict the potential demand for rental property in a particular area, because low market vacancy rates are one indicator that the market is good for landlords.
Vacancy rate in rental property is affected by a number of factors:
- If the asking rent of a property is higher than the fair market rent, vacancy may be higher than normal because it takes longer to rent the property than similar properties with a reasonable rent.
- A long period of time between one tenant moving out and another moving in due to repairs taking longer than expected can also cause a high vacancy rate.
- Major updating also affects vacancy, although any increase in rent due to renovations may offset income lost while the work was being done.
- Rental property located in an undesirable area may be harder to rent or see more tenant turnover, creating a larger number of days vacant compared to the market norm.

How to Calculate Vacancy Rate
Vacancy rate is easy to calculate for single family homes, small multifamily buildings, and property portfolios. The same calculation for vacancy rate is used for all types of rental real estate:
- Vacancy Rate = Number of Days Vacant / Number of Rentable Days
Here’s how to calculate the vacancy rate for a single-family, multifamily, and a portfolio of rental properties:
Single-family vacancy rate
If a single-family home is vacant for 2 weeks between the time the former tenant moves out and the new tenant moves in, the vacancy rate would be:
- 14 days vacant / 365 rentable days = 0.038 or 3.8%
Multifamily vacancy rate
Now let’s assume an investor has a 3-unit triplex multifamily property. Vacancy rate can be calculated based on the occupancy of each unit or the total number of vacant days compared to the total number of rentable days:
- Unit 1: 0 days vacant / 365 rentable days = 0% vacancy rate
- Unit 2: 10 days vacant / 365 rentable days = 2.7% vacancy rate
- Unit 3: 31 days vacant / 365 rentable days = 8.5% vacancy rate
In the above example, the 3-unit multifamily property has an average vacancy rate of 3.7%. The investor can also calculate the vacancy rate by dividing the total number of vacant days by the total number of rentable days:
- 41 days vacant / 1,095 rentable days (365 days x 3 units) = 3.7%
Calculating the vacancy rate based on the aggregate number of days gives the investor a high-level view of the property occupancy.
However, not having vacancy information on a per-unit basis leaves out valuable information. For example, if one unit consistently experiences a higher vacancy rate than the other two, it may be an indication that the property requires updating or the rent for that specific unit is too high.
Portfolio vacancy rate
Finally, let’s look at how to calculate the vacancy rate for a rental property portfolio with one 3-unit multifamily property and four single-family properties:
- Unit 1: 0 days vacant / 365 rentable days = 0% vacancy rate
- Unit 2: 10 days vacant / 365 rentable days = 2.7% vacancy rate
- Unit 3: 31 days vacant / 365 rentable days = 8.5% vacancy rate
- SFR 1: 0 days vacant / 365 rentable days = 0% vacancy rate
- SFR 2: 18 days vacant / 365 rentable days = 4.9% vacancy rate
- SFR 3: 20 days vacant / 365 rentable days = 5.5% vacancy rate
- SFR 4: 40 days vacant / 365 rentable days = 11.0% vacancy rate
Average portfolio vacancy rate = 4.7%
Vacancy rate tells an investor how much potential rental income is being lost due to the unit sitting empty waiting for a new tenant. In the portfolio above, if the gross average potential income from each rental unit is $1,200 per month, the total rental income lost to vacancy is $4,738:
- Gross potential rental income = 7 units x $1,200 per month x 12 months = $100,800
- Vacancy expense = 4.7% x $100,800 = $4,738
- Effective gross rental income = $100,800 gross potential rental income – $4,738 vacancy expense = $96,062
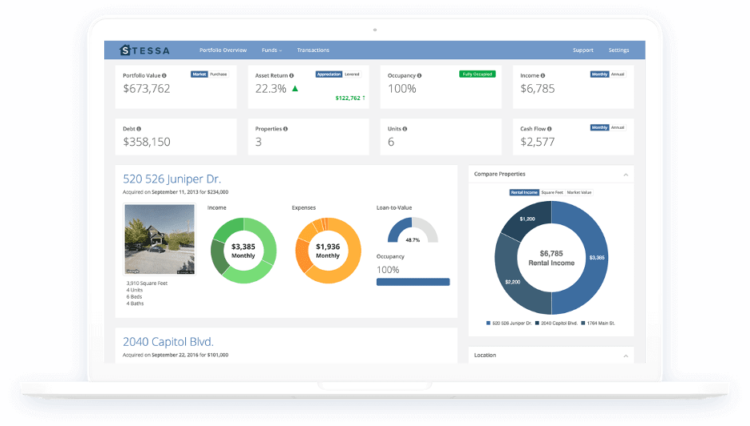
Have existing properties that you want to track the performance of? Check out Stessa. Get 24/7 visibility into your portfolio’s performance with reports that are automatically generated and updated in real time. Create income statements, balance sheets, cash flow reports, and more, in just a couple clicks. Best of all, it’s free.
What is a Normal Rental Vacancy Rate?
While no real estate investor likes to lose money, having some vacancy is inevitable during the time a property is owned. Tenants come and go, an eviction may need to be done, or an owner may decide to add value by renovating a home and charging a higher rent.
According to the Federal Reserve, the rental vacancy rate for the United States is 6.8% (as of Q1 2021). But what a real estate investor really needs to know is how the vacancy rate of the property he owns compares to the normal vacancy rate in the local market place.
There are several resources to use to determine the normal vacancy rate for properties in the same city or area:
Real estate agents and associations
A real estate agent can use the local MLS to calculate the days on market before a property is rented to a tenant. Many local real estate associations also publish monthly reports showing rental activity by county, city, and submarket.
Property management companies
The best property management companies are normally happy to share vacancy rate data with you, in the hope of gaining a new client. Be sure to ask the manager what the market average vacancy rate is compared to the average vacancy rate for all of the properties they manage, and which the homes are located that are renting the quickest.
Local governments
Local community development departments are another good source for gathering vacancy rate data on the local market. Often the information is published on the city’s website, although it might take some time to search.
6 Factors Affecting Vacancy Rate
There are a number of factors affecting how often and how long a property is vacant. Some are completely controllable by the landlord, while others are mainly due to forces in the marketplace:
- Economic factors such as a declining population or a rise in the local unemployment rate, caused in part by people and businesses relocating;
- Competition in the form of new rental property coming to market, such as a newly built apartment building nearby or a large build-to-suit (BTS) subdivision of single-family rental properties;
- Rental rates that are too high and result in higher tenant turnover with longer periods of time between tenants when renters feel they can find a better value for their money elsewhere;
- Lack of demand for a specific property type, such as having too few or too many bedrooms for the market served or an outdated floor plan that does feature amenities that tenants are seeking;
- Tenant maintenance requests not being promptly addressed, such as fixing a water leak that could eventually cause mold or replacing a faulty door lock that affects the safety and security of the tenant;
- An understaffed or inexperienced property management company that has caused tenant dissatisfaction and declining property value due to poor upkeep and rent collection.
How Owners Can Reduce Vacancy Rate
Reducing vacancy can help to increase property value over the long term by minimizing unnecessary tenant turnover expenses and keeping cash flow more predictable. There are a few strategies an investor can use to reduce the vacancy rate of their rental properties:
- Forecast the potential demand for rental property in the market before investing to analyze rental strategies that can make renting more attractive than buying for tenants;
- Develop accurate rent estimates by using free online tools such as Stessa Rent Estimate or Rentometer;
- Aggressively market vacant property online and offline using sources such as Zillow, Homes.com, yard signage, and bulletin board advertising;
- Use a tenant screening service to receive credit reports, background checks, and tenant rental history before signing a lease with a new tenant;
- Consider hiring a property manager who is vetted and experienced;
- Offer good tenants incentives for renewing the lease such as a gift card or free carpet cleaning.
- Sign up for a free account with Stessa to identify opportunities for tenant satisfaction.
Use Vacancy Rate in Other Rental Property Metrics
Vacancy rate has a direct impact on gross rental income, and the longer a property sits on the market vacant the less value it has to an investor. Other rental property calculations that are affected by vacancy rate include:
Net operating income (NOI)
Total of all income less all expenses, excluding the mortgage payment.
- Rental income + Other income (such as pet rent) – Vacancy expense – Operating expenses (except mortgage payment) = Net operating income (NOI)
Capitalization rate
Ratio that compares NOI to property value or sales price.
- Cap Rate = NOI / Property value
Cash flow
Cash remaining after all expenses including the mortgage have been paid.
Cash on cash return
Measures the cash income received compared to the amount of cash invested.
- Cash on Cash Return = Annual pre-tax cash flow / Total cash invested
Gross rent multiplier (GRM)
Compares the gross annual rents received to the property value.
- GRM = Property price / Gross annual rental income
Return on investment (ROI)
Measures the annual return of an investment compared to the total amount invested, and will vary based on the amount of cash invested, capital expenses, and the amount of leverage used to purchase a property.
- ROI = Annual return / Total investment